Sallie Mae 2007 Annual Report Download - page 47
Download and view the complete annual report
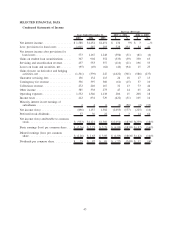
Please find page 47 of the 2007 Sallie Mae annual report below. You can navigate through the pages in the report by either clicking on the pages listed below, or by using the keyword search tool below to find specific information within the annual report.December 31, 2005. On a pre-tax basis, year-to-date 2006 net income of $2.0 billion was a 6 percent decrease
from the $2.1 billion in pre-tax net income earned in the year ended December 31, 2005. The larger
percentage decrease in year-over-year, after-tax net income versus pre-tax net income is driven by the tax
accounting permanent impact of excluding $360 million in unrealized equity forward losses from 2006 taxable
income and excluding $121 million of unrealized equity forward gains from 2005 taxable income. Fluctuations
in the effective tax rate were primarily driven by the permanent tax impact of excluding non-taxable gains and
losses on equity forward contracts as discussed above. The net effect from excluding non-taxable gains and
losses on equity forward contracts from taxable income was an increase in the effective tax rate from
34 percent in the year ended December 31, 2005 to 42 percent in the year ended December 31, 2006.
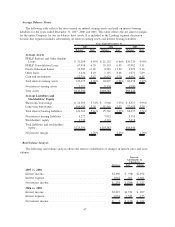
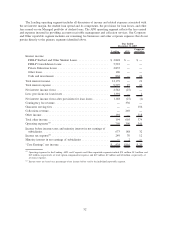
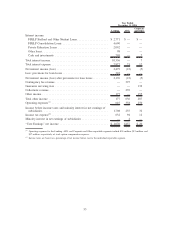
Year-over-year net interest income is roughly unchanged as the $12 billion increase in average interest
earning assets was offset by a 23 basis point decrease in the net interest margin. The year-over-year decrease
in the net interest margin is due to higher average interest rates which reduced Floor Income by $155 million,
and to the increase in the average balance of lower yielding cash and investments.
Securitization gains increased by $350 million in the year ended December 31, 2006 versus 2005. The
securitization gains for 2006 were primarily driven by the three off-balance sheet Private Education Loan
securitizations, which had total pre-tax gains of $830 million or 16 percent of the amount securitized, versus
two off-balance sheet Private Education Loan securitizations in 2005, which had pre-tax gains of $453 million
or 15 percent of the amount securitized.
For the year ended December 31, 2006, servicing and securitization revenue increased by $196 million to
$553 million. The increase in servicing and securitization revenue can be attributed to $103 million in lower
impairments on our Retained Interests and the growth in the average balance of off-balance sheet student
loans. Impairments are primarily caused by the effect of FFELP Consolidation Loan activity on our FFELP
Stafford securitization trusts. Pre-tax impairments on our Retained Interests in securitizations totaled $157 mil-
lion for the year ended December 31, 2006 versus $260 million for the year ended December 31, 2005.
In 2006, net losses on derivative and hedging activities were $339 million, a decrease of $586 million
from the net gains of $247 million in 2005. This decrease primarily relates to $230 million of unrealized
losses in 2006, versus unrealized gains of $634 million in the prior year, which resulted in a year-over-year
reduction in pre-tax income of $864 million. The effect of the unrealized losses was partially offset by a
$278 million reduction in realized losses on derivatives and hedging activities on instruments that were not
accounted for as hedges. The decrease in unrealized gains was primarily due to the impact of a lower SLM
stock price on our equity forward contracts which resulted in a mark-to-market unrealized loss of $360 million
in 2006 versus an unrealized gain of $121 million in the year-ago period, and to a decrease of $305 million in
unrealized gains on Floor Income Contracts. The smaller unrealized gains on our Floor Income Contracts were
primarily caused by the relationship between the Floor Income Contracts’ strike prices versus the estimated
forward interest rates during 2006 versus 2005.
Fee and other income and collections revenue increased $192 million from $915 million for the year
ended December 31, 2005 to $1.1 billion for the year ended December 31, 2006. Operating expenses increased
by $208 million year-over-year. This increase in operating expenses can primarily be attributed to $63 million
of stock option compensation expense, due to the implementation of SFAS No. 123(R) in the first quarter of
2006 and to $33 million related to expenses for Upromise, acquired in August 2006.
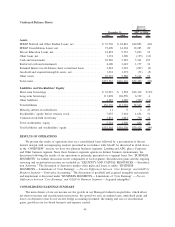
Our Managed student loan portfolio grew by $19.6 billion (or 16 percent), from $122.5 billion at
December 31, 2005 to $142.1 billion at December 31, 2006. In 2006 we acquired $37.4 billion of student
loans, a 24 percent increase over the $30.2 billion acquired in the year-ago period. The 2006 acquisitions
included $8.4 billion in Private Education Loans, a 31 percent increase over the $6.4 billion acquired in 2005.
In the year ended December 31, 2006, we originated $23.4 billion of student loans through our Preferred
Channel, an increase of 9 percent over the $21.4 billion originated in the year-ago period.
46


