Sallie Mae 2007 Annual Report Download - page 12
Download and view the complete annual report
Please find page 12 of the 2007 Sallie Mae annual report below. You can navigate through the pages in the report by either clicking on the pages listed below, or by using the keyword search tool below to find specific information within the annual report.-
 1
1 -
 2
2 -
 3
3 -
 4
4 -
 5
5 -
 6
6 -
 7
7 -
 8
8 -
 9
9 -
 10
10 -
 11
11 -
 12
12 -
 13
13 -
 14
14 -
 15
15 -
 16
16 -
 17
17 -
 18
18 -
 19
19 -
 20
20 -
 21
21 -
 22
22 -
23
-
24
-
25
-
26
-
27
-
28
-
29
-
30
-
31
-
32
-
33
-
34
-
35
-
36
-
37
-
38
-
39
-
40
-
41
-
42
-
43
-
44
-
45
-
46
-
47
-
48
-
49
-
50
-
51
-
52
-
53
-
54
-
55
-
56
-
57
-
58
-
59
-
60
-
61
-
62
-
63
-
64
-
65
-
66
-
67
-
68
-
69
-
70
-
71
-
72
-
73
-
74
-
75
-
76
-
77
-
78
-
79
-
80
-
81
-
82
-
83
-
84
-
85
-
86
-
87
-
88
-
89
-
90
-
91
-
92
-
93
-
94
-
95
-
96
-
97
-
98
-
99
-
100
-
101
-
102
-
103
-
104
-
105
-
106
-
107
-
108
-
109
-
110
-
111
-
112
-
113
-
114
-
115
-
116
-
117
-
118
-
119
-
120
-
121
-
122
-
123
-
124
-
125
-
126
-
127
-
128
-
129
-
130
-
131
-
132
-
133
-
134
-
135
-
136
-
137
-
138
-
139
-
140
-
141
-
142
-
143
-
144
-
145
-
146
-
147
-
148
-
149
-
150
-
151
-
152
-
153
-
154
-
155
-
156
-
157
-
158
-
159
-
160
-
161
-
162
-
163
-
164
-
165
-
166
-
167
-
168
-
169
-
170
-
171
-
172
-
173
-
174
-
175
-
176
-
177
-
178
-
179
-
180
-
181
-
182
-
183
-
184
-
185
-
186
-
187
-
188
-
189
-
190
-
191
-
192
-
193
-
194
-
195
-
196
-
197
-
198
-
199
-
200
-
201
-
202
-
203
-
204
-
205
-
206
-
207
-
208
-
209
-
210
-
211
-
212
-
213
-
214
-
215
-
216
-
217
-
218
-
219
 |
 |

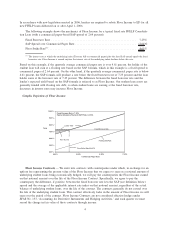
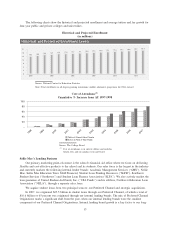
Student Lending Marketplace
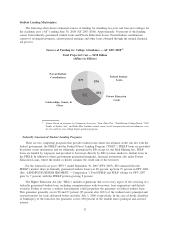
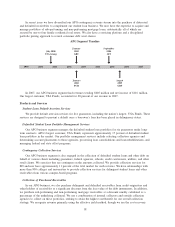
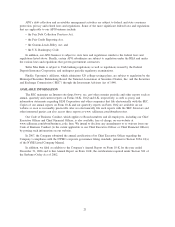
The following chart shows estimated sources of funding for attending two-year and four-year colleges for
the academic year (“AY”) ending June 30, 2008 (AY 2007-2008). Approximately 36 percent of the funding
comes from federally guaranteed student loans and Private Education Loans. Parent/student contributions
consist of savings/investments, current period earnings and other loans obtained through the normal financial
aid process.
Sources of Funding for College Attendance — AY 2007-2008
(1)
Total Projected Cost — $258 Billion
(dollars in billions)
$18
$74
$71
$95
Parent/Student
Contributions Federal Student
Loans
Private Education
Loans
Scholarships, Grants, &
Other
(1)
Source: Based on estimates by Octameron Associates, “Don’t Miss Out,” 32nd Edition; College Board, “2007
Trends in Student Aid”; and Sallie Mae. Includes tuition, room, board, transportation and miscellaneous costs
for two and four year college degree-granting programs.
Federally Guaranteed Student Lending Programs
There are two competing programs that provide student loans where the ultimate credit risk lies with the
federal government: the FFELP and the Federal Direct Lending Program (“FDLP”). FFELP loans are provided
by private sector institutions and are ultimately guaranteed by ED except for the Risk Sharing loss. FDLP
loans are funded by taxpayers and provided to borrowers directly by ED on terms similar to student loans in
the FFELP. In addition to these government guaranteed programs, financial institutions also make Private
Education Loans, where the lender or holder assumes the credit risk of the borrower.
For the federal fiscal year (“FFY”) ended September 30, 2007 (FFY 2007), ED estimated that the
FFELP’s market share in federally guaranteed student loans was 80 percent, up from 79 percent in FFY 2006.
(See “LENDING BUSINESS SEGMENT — Competition.”) Total FFELP and FDLP volume for FFY 2007
grew by 7 percent, with the FFELP portion growing 8 percent.
The Higher Education Act (the “HEA”) includes regulations that cover every aspect of the servicing of a
federally guaranteed student loan, including communications with borrowers, loan originations and default
aversion. Failure to service a student loan properly could jeopardize the guarantee on federal student loans.
This guarantee generally covers 98 and 97 percent (95 percent after 2012) of the student loan’s principal and
accrued interest for loans disbursed before and after July 1, 2006, respectively. In the case of death, disability
or bankruptcy of the borrower, the guarantee covers 100 percent of the student loan’s principal and accrued
interest.
11