Sallie Mae 2007 Annual Report Download - page 87
Download and view the complete annual report
Please find page 87 of the 2007 Sallie Mae annual report below. You can navigate through the pages in the report by either clicking on the pages listed below, or by using the keyword search tool below to find specific information within the annual report.-
 1
1 -
2
-
3
-
4
-
5
-
6
-
7
-
8
-
9
-
10
-
11
-
12
-
13
-
14
-
15
-
16
-
17
-
18
-
19
-
20
-
21
-
22
-
23
-
24
-
25
-
26
-
27
-
28
-
29
-
30
-
31
-
32
-
33
-
34
-
35
-
36
-
37
-
38
-
39
-
40
-
41
-
42
-
43
-
44
-
45
-
46
-
47
-
48
-
49
-
50
-
51
-
52
-
53
-
54
-
55
-
56
-
57
-
58
-
59
-
60
-
61
-
62
-
63
-
64
-
65
-
66
-
67
-
68
-
69
-
70
-
71
-
72
-
73
-
74
-
75
-
76
-
 77
77 -
 78
78 -
 79
79 -
 80
80 -
 81
81 -
 82
82 -
 83
83 -
 84
84 -
 85
85 -
 86
86 -
 87
87 -
 88
88 -
 89
89 -
 90
90 -
 91
91 -
 92
92 -
 93
93 -
 94
94 -
 95
95 -
 96
96 -
 97
97 -
98
-
99
-
100
-
101
-
102
-
103
-
104
-
105
-
106
-
107
-
108
-
109
-
110
-
111
-
112
-
113
-
114
-
115
-
116
-
117
-
118
-
119
-
120
-
121
-
122
-
123
-
124
-
125
-
126
-
127
-
128
-
129
-
130
-
131
-
132
-
133
-
134
-
135
-
136
-
137
-
138
-
139
-
140
-
141
-
142
-
143
-
144
-
145
-
146
-
147
-
148
-
149
-
150
-
151
-
152
-
153
-
154
-
155
-
156
-
157
-
158
-
159
-
160
-
161
-
162
-
163
-
164
-
165
-
166
-
167
-
168
-
169
-
170
-
171
-
172
-
173
-
174
-
175
-
176
-
177
-
178
-
179
-
180
-
181
-
182
-
183
-
184
-
185
-
186
-
187
-
188
-
189
-
190
-
191
-
192
-
193
-
194
-
195
-
196
-
197
-
198
-
199
-
200
-
201
-
202
-
203
-
204
-
205
-
206
-
207
-
208
-
209
-
210
-
211
-
212
-
213
-
214
-
215
-
216
-
217
-
218
-
219
 |
 |

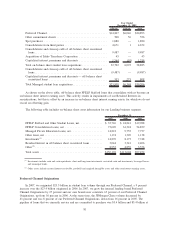
applications received on or after June 15, 2006. The single-holder rule had previously required that when a
lender held all of the FFELP Stafford loans of a particular borrower whose loans were held by a single lender,
in most cases that borrower could only obtain a FFELP Consolidation Loan from that lender.
During 2006, Private Education Loan consolidations were introduced as a separate product line. We
expect this product line to grow in the future and will aggressively protect our portfolio against third-party
consolidation of Private Education Loans.
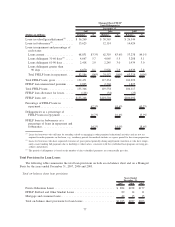
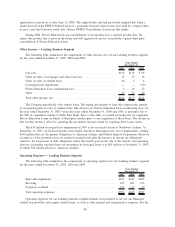
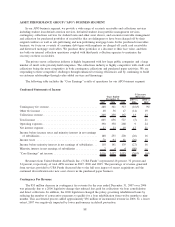
Other Income — Lending Business Segment
The following table summarizes the components of other income, net, for our Lending business segment
for the years ended December 31, 2007, 2006 and 2005.
2007 2006 2005
Years Ended
December 31,
Late fees ................................................... $134 $119 $ 96
Gains on sales of mortgages and other loan fees...................... 11 15 18
Gains on sales of student loans .................................. 24 2 4
Leveraged lease impairment..................................... — — (39)
Private Education Loan warehousing fees........................... 2 16 12
Other ..................................................... 23 25 20
Total other income, net ........................................ $194 $177 $111
The Company periodically sells student loans. The timing and amount of loan sales impacts the amount
of recognized gains on sales of student loans. The decrease in “Private Education Loan warehousing fees” for
the year ended December 31, 2007 versus the years ended December 31, 2006 and 2005, is primarily due to
the shift of origination volume to Sallie Mae Bank. Prior to this shift, we earned servicing fees for originated
Private Education Loans on behalf of third-party lenders prior to our acquisition of those loans. The decline in
this revenue stream is offset by capturing the net interest income earned by acquiring these loans earlier.
The $39 million leveraged lease impairment in 2005 is for an aircraft leased to Northwest Airlines. At
December 31, 2007, we had investments in leveraged and direct financing leases, net of impairments, totaling
$100 million that are the general obligations of American Airlines and Federal Express Corporation. Based on
an analysis of the potential losses on certain leveraged leases plus the increase in current tax obligations
related to the forgiveness of debt obligations and/or the taxable gain on the sale of the aircraft, our remaining
after-tax accounting exposure from our investment in leveraged leases was $63 million at December 31, 2007,
of which $46 million relates to American Airlines.
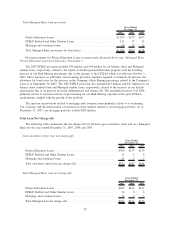
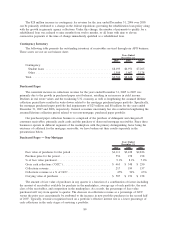
Operating Expenses — Lending Business Segment
The following table summarizes the components of operating expenses for our Lending business segment
for the years ended December 31, 2007, 2006 and 2005.
2007 2006 2005
Years Ended
December 31,
Sales and originations ......................................... $351 $327 $285
Servicing .................................................. 227 201 193
Corporate overhead ........................................... 131 117 69
Total operating expenses ....................................... $709 $645 $547
Operating expenses for our Lending business segment include costs incurred to service our Managed
student loan portfolio and acquire student loans, as well as other general and administrative expenses. For the
86