Sallie Mae 2007 Annual Report Download - page 186
Download and view the complete annual report
Please find page 186 of the 2007 Sallie Mae annual report below. You can navigate through the pages in the report by either clicking on the pages listed below, or by using the keyword search tool below to find specific information within the annual report.-
 1
1 -
2
-
3
-
4
-
5
-
6
-
7
-
8
-
9
-
10
-
11
-
12
-
13
-
14
-
15
-
16
-
17
-
18
-
19
-
20
-
21
-
22
-
23
-
24
-
25
-
26
-
27
-
28
-
29
-
30
-
31
-
32
-
33
-
34
-
35
-
36
-
37
-
38
-
39
-
40
-
41
-
42
-
43
-
44
-
45
-
46
-
47
-
48
-
49
-
50
-
51
-
52
-
53
-
54
-
55
-
56
-
57
-
58
-
59
-
60
-
61
-
62
-
63
-
64
-
65
-
66
-
67
-
68
-
69
-
70
-
71
-
72
-
73
-
74
-
75
-
76
-
77
-
78
-
79
-
80
-
81
-
82
-
83
-
84
-
85
-
86
-
87
-
88
-
89
-
90
-
91
-
92
-
93
-
94
-
95
-
96
-
97
-
98
-
99
-
100
-
101
-
102
-
103
-
104
-
105
-
106
-
107
-
108
-
109
-
110
-
111
-
112
-
113
-
114
-
115
-
116
-
117
-
118
-
119
-
120
-
121
-
122
-
123
-
124
-
125
-
126
-
127
-
128
-
129
-
130
-
131
-
132
-
133
-
134
-
135
-
136
-
137
-
138
-
139
-
140
-
141
-
142
-
143
-
144
-
145
-
146
-
147
-
148
-
149
-
150
-
151
-
152
-
153
-
154
-
155
-
156
-
157
-
158
-
159
-
160
-
161
-
162
-
163
-
164
-
165
-
166
-
167
-
168
-
169
-
170
-
171
-
172
-
173
-
174
-
175
-
 176
176 -
 177
177 -
 178
178 -
 179
179 -
 180
180 -
 181
181 -
 182
182 -
 183
183 -
 184
184 -
 185
185 -
 186
186 -
 187
187 -
 188
188 -
 189
189 -
 190
190 -
 191
191 -
 192
192 -
 193
193 -
 194
194 -
 195
195 -
 196
196 -
197
-
198
-
199
-
200
-
201
-
202
-
203
-
204
-
205
-
206
-
207
-
208
-
209
-
210
-
211
-
212
-
213
-
214
-
215
-
216
-
217
-
218
-
219
 |
 |
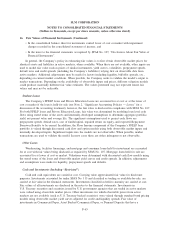
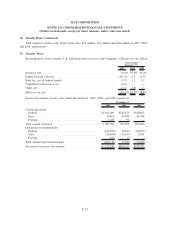
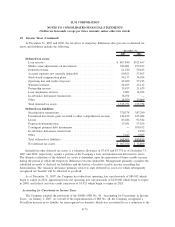
16. Fair Values of Financial Instruments (Continued)
• In the consolidated balance sheet for instruments carried lower of cost or market with impairment
charges recorded in the consolidated statement of income; and
• In the notes to the financial statements as required by SFAS No. 107, “Disclosures About Fair Value of
Financial Instruments”.
In general, the Company’s policy in estimating fair values is to first obtain observable market prices for
identical assets and liabilities in active markets, where available. When these are not available, other inputs are
used to model fair value such as prices of similar instruments, yield curves, volatilities, prepayment speeds,
default rates and credit spreads (including the Company’s liabilities) relying first on observable data from
active markets. Additional adjustments may be made for factors including liquidity, bid/offer spreads, etc.,
depending on current market conditions. When possible, the Company seeks to validate the model’s output to
market transactions. Depending on the availability of observable inputs and prices, different valuation models
could produce materially different fair value estimates. The values presented may not represent future fair
values and may not be realizable.
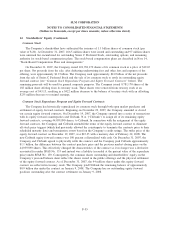
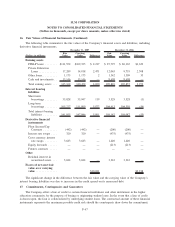
Student Loans
The Company’s FFELP loans and Private Education Loans are accounted for at cost or at the lower of
cost or market if the loan is held-for-sale (see Note 2, “Significant Accounting Policies — Loans,” for a
discussion of the accounting treatment); however, the fair value is disclosed in compliance with SFAS No. 107.
For both FFELP loans and Private Education Loans, fair value was determined by modeling loan level cash
flows using stated terms of the assets and internally-developed assumptions to determine aggregate portfolio
yield, net present value and average life. The significant assumptions used to project cash flows are
prepayment speeds, default rates, cost of funds/capital, required return on equity, and expected Repayment
Borrower Benefits to be earned. In addition, the Floor Income component of the Company’s FFELP loan
portfolio is valued through discounted cash flow and option models using both observable market inputs and
internally developed inputs. Significant inputs into the models are not observable. When possible, market
transactions are used to validate the model. In most cases these are either infrequent or not observable.
Other Loans
Warehousing, facilities financings, and mortgage and consumer loans held for investment are accounted
for at cost with fair values being disclosed as required by SFAS No. 107. Mortgage loans held for sale are
accounted for at lower of cost or market. Valuations were determined with discounted cash flow models using
the stated terms of the loans and observable market yield curves and credit spreads. In addition, adjustments
and assumptions were made for liquidity, prepayment speeds and defaults.
Cash and Investments (Including “Restricted”)
Cash and cash equivalents are carried at cost. Carrying value approximated fair value for disclosure
purposes. Investments accounted for under SFAS No. 115 and classified as trading or available-for-sale, are
carried at fair value in the financial statements. Investments classified as held-to-maturity are carried at cost.
Fair values of all investments are disclosed in the notes to the financial statements. Investments in
U.S. Treasury securities and securities issued by U.S. government agencies that are traded in active markets
were valued using observable market prices. Other investments for which observable prices from active
markets are not available (such as U.S. Treasury-backed securities) were valued through standard bond pricing
models using observable market yield curves adjusted for credit and liquidity spreads. Fair value of
investments in Commercial Paper, Asset Backed Commercial Paper, or Demand Deposits that have a
F-65
SLM CORPORATION
NOTES TO CONSOLIDATED FINANCIAL STATEMENTS
(Dollars in thousands, except per share amounts, unless otherwise stated)