Sallie Mae 2007 Annual Report Download - page 126
Download and view the complete annual report
Please find page 126 of the 2007 Sallie Mae annual report below. You can navigate through the pages in the report by either clicking on the pages listed below, or by using the keyword search tool below to find specific information within the annual report.-
 1
1 -
2
-
3
-
4
-
5
-
6
-
7
-
8
-
9
-
10
-
11
-
12
-
13
-
14
-
15
-
16
-
17
-
18
-
19
-
20
-
21
-
22
-
23
-
24
-
25
-
26
-
27
-
28
-
29
-
30
-
31
-
32
-
33
-
34
-
35
-
36
-
37
-
38
-
39
-
40
-
41
-
42
-
43
-
44
-
45
-
46
-
47
-
48
-
49
-
50
-
51
-
52
-
53
-
54
-
55
-
56
-
57
-
58
-
59
-
60
-
61
-
62
-
63
-
64
-
65
-
66
-
67
-
68
-
69
-
70
-
71
-
72
-
73
-
74
-
75
-
76
-
77
-
78
-
79
-
80
-
81
-
82
-
83
-
84
-
85
-
86
-
87
-
88
-
89
-
90
-
91
-
92
-
93
-
94
-
95
-
96
-
97
-
98
-
99
-
100
-
101
-
102
-
103
-
104
-
105
-
106
-
107
-
108
-
109
-
110
-
111
-
112
-
113
-
114
-
115
-
 116
116 -
 117
117 -
 118
118 -
 119
119 -
 120
120 -
 121
121 -
 122
122 -
 123
123 -
 124
124 -
 125
125 -
 126
126 -
 127
127 -
 128
128 -
 129
129 -
 130
130 -
 131
131 -
 132
132 -
 133
133 -
 134
134 -
 135
135 -
 136
136 -
137
-
138
-
139
-
140
-
141
-
142
-
143
-
144
-
145
-
146
-
147
-
148
-
149
-
150
-
151
-
152
-
153
-
154
-
155
-
156
-
157
-
158
-
159
-
160
-
161
-
162
-
163
-
164
-
165
-
166
-
167
-
168
-
169
-
170
-
171
-
172
-
173
-
174
-
175
-
176
-
177
-
178
-
179
-
180
-
181
-
182
-
183
-
184
-
185
-
186
-
187
-
188
-
189
-
190
-
191
-
192
-
193
-
194
-
195
-
196
-
197
-
198
-
199
-
200
-
201
-
202
-
203
-
204
-
205
-
206
-
207
-
208
-
209
-
210
-
211
-
212
-
213
-
214
-
215
-
216
-
217
-
218
-
219
 |
 |

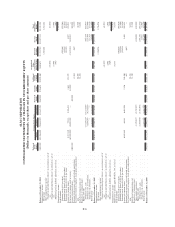
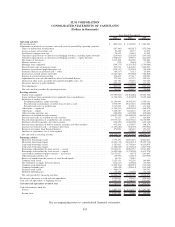
SLM CORPORATION
CONSOLIDATED STATEMENTS OF INCOME
(Dollars and shares in thousands, except per share amounts)
2007 2006 2005
Years Ended December 31,
Interest income:
FFELP Stafford and Other Student Loans .................. $2,060,993 $1,408,938 $1,014,851
FFELP Consolidation Loans............................ 4,343,138 3,545,857 2,500,008
Private Education Loans............................... 1,456,471 1,021,221 633,884
Other loans ........................................ 105,843 97,954 84,664
Cash and investments................................. 707,577 503,002 276,756
Total interest income ................................... 8,674,022 6,576,972 4,510,163
Total interest expense .................................. 7,085,772 5,122,855 3,058,718
Net interest income .................................... 1,588,250 1,454,117 1,451,445
Less: provisions for loan losses ........................... 1,015,308 286,962 203,006
Net interest income after provisions for loan losses ............ 572,942 1,167,155 1,248,439
Other income:
Gains on student loan securitizations ..................... 367,300 902,417 552,546
Servicing and securitization revenue ...................... 437,097 553,541 356,730
Losses on loans and securities, net ....................... (95,492) (49,357) (63,955)
Gains (losses) on derivative and hedging activities, net ........ (1,360,584) (339,396) 246,548
Guarantor servicing fees .............................. 156,429 132,100 115,477
Contingency fee revenue .............................. 335,737 396,830 359,907
Collections revenue .................................. 271,547 239,829 166,840
Other............................................. 385,075 338,307 273,259
Total other income .................................... 497,109 2,174,271 2,007,352
Operating expenses:
Salaries and benefits ................................. 773,863 703,210 625,024
Other............................................. 777,984 642,942 513,304
Total operating expenses ................................ 1,551,847 1,346,152 1,138,328
Income (loss) before income taxes and minority interest in net
earnings of subsidiaries ............................... (481,796) 1,995,274 2,117,463
Income tax expense .................................... 412,283 834,311 728,767
Income (loss) before minority interest in net earnings of
subsidiaries ........................................ (894,079) 1,160,963 1,388,696
Minority interest in net earnings of subsidiaries . .............. 2,315 4,007 6,412
Net income (loss) ..................................... (896,394) 1,156,956 1,382,284
Preferred stock dividends................................ 37,145 35,567 21,903
Net income (loss) attributable to common stock . .............. $ (933,539) $1,121,389 $1,360,381
Basic earnings (loss) per common share ..................... $ (2.26) $ 2.73 $ 3.25
Average common shares outstanding ....................... 412,233 410,805 418,374
Diluted earnings (loss) per common share ................... $ (2.26) $ 2.63 $ 3.05
Average common and common equivalent shares outstanding ..... 412,233 451,170 460,260
Dividends per common share ............................. $ .25 $ .97 $ .85
See accompanying notes to consolidated financial statements.
F-5