Sallie Mae 2007 Annual Report Download - page 205
Download and view the complete annual report
Please find page 205 of the 2007 Sallie Mae annual report below. You can navigate through the pages in the report by either clicking on the pages listed below, or by using the keyword search tool below to find specific information within the annual report.-
 1
1 -
2
-
3
-
4
-
5
-
6
-
7
-
8
-
9
-
10
-
11
-
12
-
13
-
14
-
15
-
16
-
17
-
18
-
19
-
20
-
21
-
22
-
23
-
24
-
25
-
26
-
27
-
28
-
29
-
30
-
31
-
32
-
33
-
34
-
35
-
36
-
37
-
38
-
39
-
40
-
41
-
42
-
43
-
44
-
45
-
46
-
47
-
48
-
49
-
50
-
51
-
52
-
53
-
54
-
55
-
56
-
57
-
58
-
59
-
60
-
61
-
62
-
63
-
64
-
65
-
66
-
67
-
68
-
69
-
70
-
71
-
72
-
73
-
74
-
75
-
76
-
77
-
78
-
79
-
80
-
81
-
82
-
83
-
84
-
85
-
86
-
87
-
88
-
89
-
90
-
91
-
92
-
93
-
94
-
95
-
96
-
97
-
98
-
99
-
100
-
101
-
102
-
103
-
104
-
105
-
106
-
107
-
108
-
109
-
110
-
111
-
112
-
113
-
114
-
115
-
116
-
117
-
118
-
119
-
120
-
121
-
122
-
123
-
124
-
125
-
126
-
127
-
128
-
129
-
130
-
131
-
132
-
133
-
134
-
135
-
136
-
137
-
138
-
139
-
140
-
141
-
142
-
143
-
144
-
145
-
146
-
147
-
148
-
149
-
150
-
151
-
152
-
153
-
154
-
155
-
156
-
157
-
158
-
159
-
160
-
161
-
162
-
163
-
164
-
165
-
166
-
167
-
168
-
169
-
170
-
171
-
172
-
173
-
174
-
175
-
176
-
177
-
178
-
179
-
180
-
181
-
182
-
183
-
184
-
185
-
186
-
187
-
188
-
189
-
190
-
191
-
192
-
193
-
194
-
 195
195 -
 196
196 -
 197
197 -
 198
198 -
 199
199 -
 200
200 -
 201
201 -
 202
202 -
 203
203 -
 204
204 -
 205
205 -
 206
206 -
 207
207 -
 208
208 -
 209
209 -
 210
210 -
 211
211 -
 212
212 -
 213
213 -
 214
214 -
 215
215 -
216
-
217
-
218
-
219
 |
 |

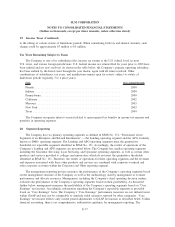
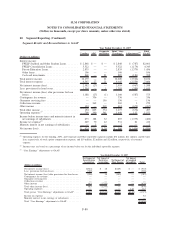
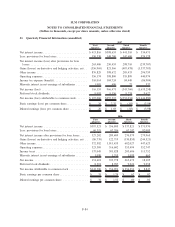
21. Quarterly Financial Information (unaudited)
First
Quarter
Second
Quarter
Third
Quarter
Fourth
Quarter
2007
Net interest income ............................ $413,816 $398,653 $ 441,310 $ 334,471
Less: provisions for loan losses ................... 150,330 148,200 142,600 574,178
Net interest income (loss) after provisions for loan
losses .................................... 263,486 250,453 298,710 (239,707)
Gains (losses) on derivative and hedging activities, net . . (356,969) 821,566 (487,478) (1,337,703)
Other income ................................ 876,829 398,672 285,433 296,759
Operating expenses ............................ 356,174 398,800 355,899 440,974
Income tax expense (benefit) ..................... 310,014 104,724 84,449 (86,904)
Minority interest in net earnings of subsidiaries ....... 1,005 696 77 537
Net income (loss) ............................. 116,153 966,471 (343,760) (1,635,258)
Preferred stock dividends........................ 9,093 9,156 9,274 9,622
Net income (loss) attributable to common stock ....... $107,060 $957,315 $(353,034) $(1,644,880)
Basic earnings (loss) per common share ............. $ .26 $ 2.32 $ (.85) $ (3.98)
Diluted earnings (loss) per common share . . . ........ $ .26 $ 1.03 $ (.85) $ (3.98)
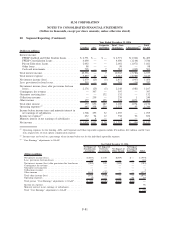
First
Quarter
Second
Quarter
Third
Quarter
Fourth
Quarter
2006
Net interest income ............................ $387,521 $ 356,805 $ 337,821 $ 371,970
Less: provisions for loan losses .................... 60,319 67,396 67,242 92,005
Net interest income after provisions for loan losses ..... 327,202 289,409 270,579 279,965
Gains (losses) on derivative and hedging activities, net . . (86,739) 122,719 (130,855) (244,521)
Other income ................................. 372,582 1,011,435 682,027 447,623
Operating expenses............................. 323,309 316,602 353,494 352,747
Income taxes ................................. 137,045 381,828 203,686 111,752
Minority interest in net earnings of subsidiaries ........ 1,090 1,355 1,099 463
Net income .................................. 151,601 723,778 263,472 18,105
Preferred stock dividends ........................ 8,301 8,787 9,221 9,258
Net income attributable to common stock ............ $143,300 $ 714,991 $ 254,251 $ 8,847
Basic earnings per common share .................. $ .35 $ 1.74 $ .62 $ .02
Diluted earnings per common share ................ $ .34 $ 1.52 $ .60 $ .02
F-84
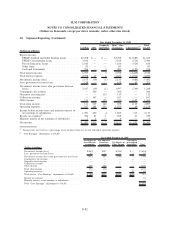
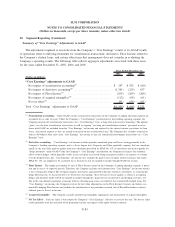
SLM CORPORATION
NOTES TO CONSOLIDATED FINANCIAL STATEMENTS
(Dollars in thousands, except per share amounts, unless otherwise stated)