Sallie Mae 2007 Annual Report Download - page 50
Download and view the complete annual report
Please find page 50 of the 2007 Sallie Mae annual report below. You can navigate through the pages in the report by either clicking on the pages listed below, or by using the keyword search tool below to find specific information within the annual report.-
 1
1 -
2
-
3
-
4
-
5
-
6
-
7
-
8
-
9
-
10
-
11
-
12
-
13
-
14
-
15
-
16
-
17
-
18
-
19
-
20
-
21
-
22
-
23
-
24
-
25
-
26
-
27
-
28
-
29
-
30
-
31
-
32
-
33
-
34
-
35
-
36
-
37
-
38
-
39
-
 40
40 -
 41
41 -
 42
42 -
 43
43 -
 44
44 -
 45
45 -
 46
46 -
 47
47 -
 48
48 -
 49
49 -
 50
50 -
 51
51 -
 52
52 -
 53
53 -
 54
54 -
 55
55 -
 56
56 -
 57
57 -
 58
58 -
 59
59 -
 60
60 -
61
-
62
-
63
-
64
-
65
-
66
-
67
-
68
-
69
-
70
-
71
-
72
-
73
-
74
-
75
-
76
-
77
-
78
-
79
-
80
-
81
-
82
-
83
-
84
-
85
-
86
-
87
-
88
-
89
-
90
-
91
-
92
-
93
-
94
-
95
-
96
-
97
-
98
-
99
-
100
-
101
-
102
-
103
-
104
-
105
-
106
-
107
-
108
-
109
-
110
-
111
-
112
-
113
-
114
-
115
-
116
-
117
-
118
-
119
-
120
-
121
-
122
-
123
-
124
-
125
-
126
-
127
-
128
-
129
-
130
-
131
-
132
-
133
-
134
-
135
-
136
-
137
-
138
-
139
-
140
-
141
-
142
-
143
-
144
-
145
-
146
-
147
-
148
-
149
-
150
-
151
-
152
-
153
-
154
-
155
-
156
-
157
-
158
-
159
-
160
-
161
-
162
-
163
-
164
-
165
-
166
-
167
-
168
-
169
-
170
-
171
-
172
-
173
-
174
-
175
-
176
-
177
-
178
-
179
-
180
-
181
-
182
-
183
-
184
-
185
-
186
-
187
-
188
-
189
-
190
-
191
-
192
-
193
-
194
-
195
-
196
-
197
-
198
-
199
-
200
-
201
-
202
-
203
-
204
-
205
-
206
-
207
-
208
-
209
-
210
-
211
-
212
-
213
-
214
-
215
-
216
-
217
-
218
-
219
 |
 |

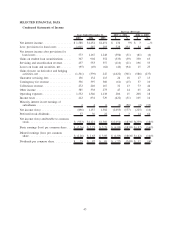
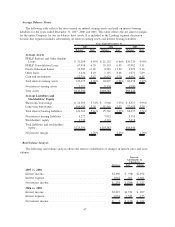
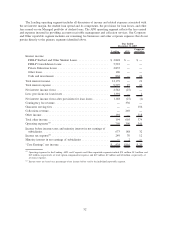
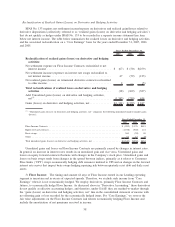
Student Loan Spread Analysis — On-Balance Sheet
The following table analyzes the reported earnings from on-balance sheet student loans. For an analysis
of our student loan spread for the entire portfolio of Managed student loans on a similar basis to the on-
balance sheet analysis, see “LENDING BUSINESS SEGMENT — Student Loan Spread Analysis — ‘Core
Earnings’ Basis.”
2007 2006 2005
Years Ended December 31,
On-Balance Sheet
Student loan yield, before Floor Income .................... 7.96% 7.94% 6.22%
Gross Floor Income ................................... .05 .04 .25
Consolidation Loan Rebate Fees.......................... (.60) (.67) (.65)
Repayment Borrower Benefits ........................... (.12) (.12) (.11)
Premium and discount amortization ....................... (.16) (.14) (.16)
Student loan net yield ................................. 7.13 7.05 5.55
Student loan cost of funds . ............................. (5.56) (5.36) (3.69)
Student loan spread, before Interim ABCP Facility Fees
(1)(2)
..... 1.57% 1.69% 1.86%
Interim ABCP Facility Fees
(3)
........................... (.04) — —
Student loan spread
(1)
................................. 1.53% 1.69% 1.86%
Average Balances
On-balance sheet student loans
(1)
......................... $104,740 $84,173 $74,724
(1)
Excludes the effect of the Wholesale Consolidation Loan portfolio on the student loan spread and average balance for the
years ended December 31, 2007 and 2006.
(2)
Student loan spread including the effect of Wholesale Consolidation Loans . . . 1.44% 1.68% 1.86%
(3)
The Interim ABCP Facility Fees are the commitment and liquidity fees related to a financing facility in connection with
the Merger Agreement.
The table above shows the various items that impact our student loan spread. Gross Floor Income (Floor
Income earned before payments on Floor Income Contracts) is impacted by the level of interest rates and the
percentage of the FFELP portfolio eligible to earn Floor Income. The spread impact from Consolidation Loan
Rebate Fees fluctuates as a function of the percentage of FFELP Consolidation Loans on our balance sheet.
Repayment Borrower Benefits are generally impacted by the amount of Repayment Borrower Benefits being
offered as well as the payment behavior of the underlying loans. Premium and discount amortization is
generally impacted by the prices we pay for loans and amounts capitalized related to such purchases or
originations. Premium and discount amortization is also impacted by prepayment behavior of the underlying
loans.
The decrease in our student loan spread, before Interim ABCP Facility Fees and the effect of Wholesale
Consolidation Loans, for the year ended December 31, 2007 versus 2006 was primarily due to an increase in
our cost of funds. Our cost of funds for on-balance sheet student loans excludes the impact of basis swaps that
economically hedge the re-pricing and basis mismatch between our funding and student loan asset indices, but
do not receive hedge accounting treatment under SFAS No. 133. We use basis swaps extensively to manage
our basis risk associated with our interest rate sensitive assets and liabilities. These swaps generally do not
qualify as accounting hedges, and as a result, are required to be accounted for in the “gains (losses) on
derivatives and hedging activities, net” line in the consolidated statement of income, as opposed to being
accounted for in interest expense. As a result, these basis swaps are not considered in the calculation of the
cost of funds in the above table, and in times of volatile movements of interest rates like those experienced in
the second half of 2007, the student loan spread in the above table can significantly change. See “LENDING
BUSINESS SEGMENT — Student Loan Spread Analysis — ‘Core Earnings’ Basis,” which reflects these basis
swaps in interest expense, and demonstrates the economic hedge effectiveness of these basis swaps. The
49