Sallie Mae 2007 Annual Report Download - page 57
Download and view the complete annual report
Please find page 57 of the 2007 Sallie Mae annual report below. You can navigate through the pages in the report by either clicking on the pages listed below, or by using the keyword search tool below to find specific information within the annual report.-
 1
1 -
2
-
3
-
4
-
5
-
6
-
7
-
8
-
9
-
10
-
11
-
12
-
13
-
14
-
15
-
16
-
17
-
18
-
19
-
20
-
21
-
22
-
23
-
24
-
25
-
26
-
27
-
28
-
29
-
30
-
31
-
32
-
33
-
34
-
35
-
36
-
37
-
38
-
39
-
40
-
41
-
42
-
43
-
44
-
45
-
46
-
 47
47 -
 48
48 -
 49
49 -
 50
50 -
 51
51 -
 52
52 -
 53
53 -
 54
54 -
 55
55 -
 56
56 -
 57
57 -
 58
58 -
 59
59 -
 60
60 -
 61
61 -
 62
62 -
 63
63 -
 64
64 -
 65
65 -
 66
66 -
 67
67 -
68
-
69
-
70
-
71
-
72
-
73
-
74
-
75
-
76
-
77
-
78
-
79
-
80
-
81
-
82
-
83
-
84
-
85
-
86
-
87
-
88
-
89
-
90
-
91
-
92
-
93
-
94
-
95
-
96
-
97
-
98
-
99
-
100
-
101
-
102
-
103
-
104
-
105
-
106
-
107
-
108
-
109
-
110
-
111
-
112
-
113
-
114
-
115
-
116
-
117
-
118
-
119
-
120
-
121
-
122
-
123
-
124
-
125
-
126
-
127
-
128
-
129
-
130
-
131
-
132
-
133
-
134
-
135
-
136
-
137
-
138
-
139
-
140
-
141
-
142
-
143
-
144
-
145
-
146
-
147
-
148
-
149
-
150
-
151
-
152
-
153
-
154
-
155
-
156
-
157
-
158
-
159
-
160
-
161
-
162
-
163
-
164
-
165
-
166
-
167
-
168
-
169
-
170
-
171
-
172
-
173
-
174
-
175
-
176
-
177
-
178
-
179
-
180
-
181
-
182
-
183
-
184
-
185
-
186
-
187
-
188
-
189
-
190
-
191
-
192
-
193
-
194
-
195
-
196
-
197
-
198
-
199
-
200
-
201
-
202
-
203
-
204
-
205
-
206
-
207
-
208
-
209
-
210
-
211
-
212
-
213
-
214
-
215
-
216
-
217
-
218
-
219
 |
 |

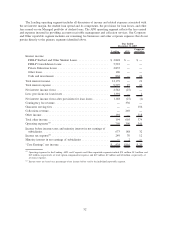
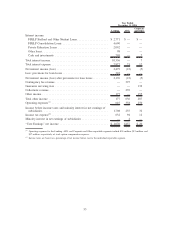
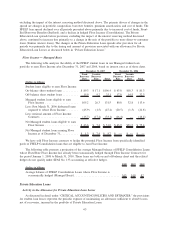
The following table summarizes “Core Earnings” securitization adjustments for the Lending operating
segment for the years ended December 31, 2007, 2006 and 2005.
2007 2006 2005
Years Ended December 31,
“Core Earnings” securitization adjustments:
Net interest income on securitized loans, before provisions for loan losses
and before intercompany transactions .......................... $(818) $(896) $(870)
Provisions for loan losses..................................... 380 16 (65)
Net interest income on securitized loans, after provisions for loan losses,
before intercompany transactions ............................. (438) (880) (935)
Intercompany transactions with off-balance sheet trusts ............... (119) (43) (34)
Net interest income on securitized loans, after provisions for loan losses . . (557) (923) (969)
Gains on student loan securitizations ............................ 367 902 552
Servicing and securitization revenue ............................. 437 553 357
Total “Core Earnings” securitization adjustments ................... $247 $532 $ (60)
“Intercompany transactions with off-balance sheet trusts” in the above table relates primarily to the losses
incurred through the repurchase of delinquent loans out of our off-balance sheet securitization trusts. When
Private Education Loans in our securitization trusts settling before September 30, 2005, become 180 days
delinquent, we typically exercise our contingent call option to repurchase these loans at par value out of the
trust and record a loss for the difference in the par value paid and the fair market value of the loan at the time
of purchase. The significant increase in these intercompany transactions from 2006 to 2007 was driven
primarily by the increase in delinquency trends and charge-offs during 2007 associated with our Private
Education Loan portfolio. We do not hold the contingent call option for any trusts settled after September 30,
2005.
2) Derivative Accounting: “Core Earnings” exclude periodic unrealized gains and losses that are
caused primarily by the one-sided mark-to-market derivative valuations prescribed by SFAS No. 133 on
derivatives that do not qualify for “hedge treatment” under GAAP. These unrealized gains and losses occur in
our Lending operating segment and in our Corporate and Other reportable segment as it relates to equity
forwards. In our “Core Earnings” presentation, we recognize the economic effect of these hedges, which
generally results in any cash paid or received being recognized ratably as an expense or revenue over the
hedged item’s life. “Core Earnings” also exclude the gain or loss on equity forward contracts that under
SFAS No. 133, are required to be accounted for as derivatives and are marked-to-market through earnings.
SFAS No. 133 requires that changes in the fair value of derivative instruments be recognized currently in
earnings unless specific hedge accounting criteria, as specified by SFAS No. 133, are met. We believe that our
derivatives are effective economic hedges, and as such, are a critical element of our interest rate risk
management strategy. However, some of our derivatives, primarily Floor Income Contracts, certain basis swaps
and equity forward contracts (discussed in detail below), do not qualify for “hedge treatment” as defined by
SFAS No. 133, and the stand-alone derivative must be marked-to-market in the income statement with no
consideration for the corresponding change in fair value of the hedged item. The gains and losses described in
“Gains (losses) on derivative and hedging activities, net” are primarily caused by interest rate and foreign
currency exchange rate volatility, changing credit spreads and changes in our stock price during the period as
well as the volume and term of derivatives not receiving hedge treatment.
Our Floor Income Contracts are written options that must meet more stringent requirements than other
hedging relationships to achieve hedge effectiveness under SFAS No. 133. Specifically, our Floor Income
Contracts do not qualify for hedge accounting treatment because the paydown of principal of the student loans
underlying the Floor Income embedded in those student loans does not exactly match the change in the
notional amount of our written Floor Income Contracts. Under SFAS No. 133, the upfront payment is deemed
a liability and changes in fair value are recorded through income throughout the life of the contract. The
56