Sallie Mae 2007 Annual Report Download - page 51
Download and view the complete annual report
Please find page 51 of the 2007 Sallie Mae annual report below. You can navigate through the pages in the report by either clicking on the pages listed below, or by using the keyword search tool below to find specific information within the annual report.-
 1
1 -
2
-
3
-
4
-
5
-
6
-
7
-
8
-
9
-
10
-
11
-
12
-
13
-
14
-
15
-
16
-
17
-
18
-
19
-
20
-
21
-
22
-
23
-
24
-
25
-
26
-
27
-
28
-
29
-
30
-
31
-
32
-
33
-
34
-
35
-
36
-
37
-
38
-
39
-
40
-
 41
41 -
 42
42 -
 43
43 -
 44
44 -
 45
45 -
 46
46 -
 47
47 -
 48
48 -
 49
49 -
 50
50 -
 51
51 -
 52
52 -
 53
53 -
 54
54 -
 55
55 -
 56
56 -
 57
57 -
 58
58 -
 59
59 -
 60
60 -
 61
61 -
62
-
63
-
64
-
65
-
66
-
67
-
68
-
69
-
70
-
71
-
72
-
73
-
74
-
75
-
76
-
77
-
78
-
79
-
80
-
81
-
82
-
83
-
84
-
85
-
86
-
87
-
88
-
89
-
90
-
91
-
92
-
93
-
94
-
95
-
96
-
97
-
98
-
99
-
100
-
101
-
102
-
103
-
104
-
105
-
106
-
107
-
108
-
109
-
110
-
111
-
112
-
113
-
114
-
115
-
116
-
117
-
118
-
119
-
120
-
121
-
122
-
123
-
124
-
125
-
126
-
127
-
128
-
129
-
130
-
131
-
132
-
133
-
134
-
135
-
136
-
137
-
138
-
139
-
140
-
141
-
142
-
143
-
144
-
145
-
146
-
147
-
148
-
149
-
150
-
151
-
152
-
153
-
154
-
155
-
156
-
157
-
158
-
159
-
160
-
161
-
162
-
163
-
164
-
165
-
166
-
167
-
168
-
169
-
170
-
171
-
172
-
173
-
174
-
175
-
176
-
177
-
178
-
179
-
180
-
181
-
182
-
183
-
184
-
185
-
186
-
187
-
188
-
189
-
190
-
191
-
192
-
193
-
194
-
195
-
196
-
197
-
198
-
199
-
200
-
201
-
202
-
203
-
204
-
205
-
206
-
207
-
208
-
209
-
210
-
211
-
212
-
213
-
214
-
215
-
216
-
217
-
218
-
219
 |
 |
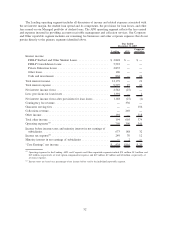
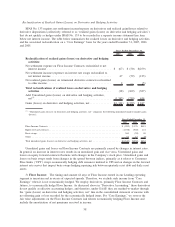
decrease in the student loan spread was also due to an increase in the estimate of uncollectible accrued interest
related to our Private Education Loans (see “LENDING BUSINESS SEGMENT — Student Loan Spread
Analysis — ‘Core Earnings’ Basis.”)
The decrease in the student loan spread before the effect of Wholesale Consolidation Loans in the year
ended December 31, 2006 versus 2005 was primarily due to the reduction in Gross Floor Income earned. A
primary driver of fluctuations in our on-balance sheet student loan spread when interest rates significantly
change from period to period can be the level of Gross Floor Income earned in the period. Interest rates
increased significantly between 2005 and 2006 which reduced Gross Floor Income earned. We believe that we
have economically hedged most of the long-term Floor Income through the sale of Floor Income Contracts,
under which we receive an upfront fee and agree to pay the counterparty the Floor Income earned on a
notional amount of student loans. These contracts do not qualify for hedge accounting treatment and as a
result the payments on the Floor Income Contracts are included in the consolidated statement of income with
“gains (losses) on derivative and hedging activities, net” rather than in student loan interest income, where the
offsetting Floor Income is recorded.
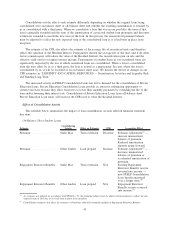
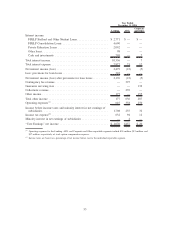
In the second half of 2006, we implemented a new loan acquisition strategy under which we began
purchasing FFELP Consolidation Loans outside of our normal origination channels, primarily via the spot
market. We refer to this volume as our Wholesale Consolidation Channel. FFELP Consolidation Loans
acquired through this channel are considered incremental volume to our core acquisition channels, which are
focused on the retail marketplace with an emphasis on our internal brand strategy. Wholesale Consolidation
Loans generally command significantly higher premiums than our originated FFELP Consolidation Loans, and
as a result, Wholesale Consolidation Loans have lower spreads. Since Wholesale Consolidation Loans are
acquired outside of our core loan acquisition channels and have different yields and return expectations than
the rest of our FFELP Consolidation Loan portfolio, we have excluded the impact of the Wholesale
Consolidation Loan volume from the student loan spread analysis to provide more meaningful period-over-
period comparisons on the performance of our student loan portfolio. We are no longer buying Wholesale
Consolidation Loans.
FEDERAL AND STATE TAXES
The Company is subject to federal and state income taxes. Our effective tax rate for the years ended
December 31, 2007, 2006 and 2005 was (86) percent, 42 percent and 34 percent, respectively. The effective
tax rate reflects the permanent impact of the exclusion of gains and losses on equity forward contracts with
respect to the Company’s stock for tax purposes. These permanent differences were a $1.6 billion loss in 2007,
a $360 million loss in 2006, and a $121 million gain in 2005.
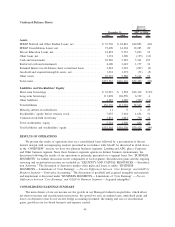
BUSINESS SEGMENTS
The results of operations of the Company’s Lending and APG operating segments are presented below.
These defined business segments operate in distinct business environments and are considered reportable
segments under SFAS No. 131, “Disclosures about Segments of an Enterprise and Related Information,” based
on quantitative thresholds applied to the Company’s financial statements. In addition, we provide other
complementary products and services through smaller operating segments that do not meet such thresholds and
are aggregated in the Corporate and Other reportable segment for financial reporting purposes. These products
and services include guarantor and loan servicing, 529 college-savings plan administration, and the operation
of an affinity marketing program.
The management reporting process measures the performance of the Company’s operating segments based
on the management structure of the Company as well as the methodology used by management to evaluate
performance and allocate resources. In accordance with the Rules and Regulations of the Securities and
Exchange Commission (“SEC”), we prepare financial statements in accordance with GAAP. In addition to
evaluating the Company’s GAAP-based financial information, management, including the Company’s chief
operation decision makers, evaluates the performance of the Company’s operating segments based on their
profitability on a basis that, as allowed under SFAS No. 131, differs from GAAP. We refer to management’s
basis of evaluating our segment results as “Core Earnings” presentations for each business segment and we
50