Sallie Mae 2007 Annual Report Download - page 62
Download and view the complete annual report
Please find page 62 of the 2007 Sallie Mae annual report below. You can navigate through the pages in the report by either clicking on the pages listed below, or by using the keyword search tool below to find specific information within the annual report.-
 1
1 -
2
-
3
-
4
-
5
-
6
-
7
-
8
-
9
-
10
-
11
-
12
-
13
-
14
-
15
-
16
-
17
-
18
-
19
-
20
-
21
-
22
-
23
-
24
-
25
-
26
-
27
-
28
-
29
-
30
-
31
-
32
-
33
-
34
-
35
-
36
-
37
-
38
-
39
-
40
-
41
-
42
-
43
-
44
-
45
-
46
-
47
-
48
-
49
-
50
-
51
-
 52
52 -
 53
53 -
 54
54 -
 55
55 -
 56
56 -
 57
57 -
 58
58 -
 59
59 -
 60
60 -
 61
61 -
 62
62 -
 63
63 -
 64
64 -
 65
65 -
 66
66 -
 67
67 -
 68
68 -
 69
69 -
 70
70 -
 71
71 -
 72
72 -
73
-
74
-
75
-
76
-
77
-
78
-
79
-
80
-
81
-
82
-
83
-
84
-
85
-
86
-
87
-
88
-
89
-
90
-
91
-
92
-
93
-
94
-
95
-
96
-
97
-
98
-
99
-
100
-
101
-
102
-
103
-
104
-
105
-
106
-
107
-
108
-
109
-
110
-
111
-
112
-
113
-
114
-
115
-
116
-
117
-
118
-
119
-
120
-
121
-
122
-
123
-
124
-
125
-
126
-
127
-
128
-
129
-
130
-
131
-
132
-
133
-
134
-
135
-
136
-
137
-
138
-
139
-
140
-
141
-
142
-
143
-
144
-
145
-
146
-
147
-
148
-
149
-
150
-
151
-
152
-
153
-
154
-
155
-
156
-
157
-
158
-
159
-
160
-
161
-
162
-
163
-
164
-
165
-
166
-
167
-
168
-
169
-
170
-
171
-
172
-
173
-
174
-
175
-
176
-
177
-
178
-
179
-
180
-
181
-
182
-
183
-
184
-
185
-
186
-
187
-
188
-
189
-
190
-
191
-
192
-
193
-
194
-
195
-
196
-
197
-
198
-
199
-
200
-
201
-
202
-
203
-
204
-
205
-
206
-
207
-
208
-
209
-
210
-
211
-
212
-
213
-
214
-
215
-
216
-
217
-
218
-
219
 |
 |

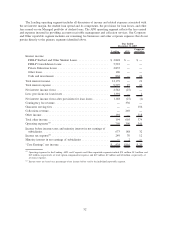
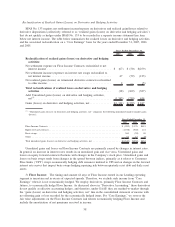
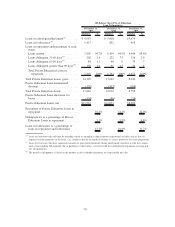
Summary of our Managed Student Loan Portfolio
The following tables summarize the components of our Managed student loan portfolio and show the
changing composition of our portfolio.
Ending Balances (net of allowance for loan losses):
FFELP
Stafford and
Other
(1)
FFELP
Consolidation
Loans
Total
FFELP
Private
Education
Loans Total
December 31, 2007
On-balance sheet:
In-school . . . . . . . . . . . . . . . . . . . . . . . . . . . . . . . $14,390 $ — $ 14,390 $ 6,735 $ 21,125
Grace and repayment . . . . . . . . . . . . . . . . . . . . . . . 20,469 72,306 92,775 9,437 102,212
Total on-balance sheet, gross . . . . . . . . . . . . . . . . . . . 34,859 72,306 107,165 16,172 123,337
On-balance sheet unamortized premium/(discount) . . . . 915 1,344 2,259 (468) 1,791
On-balance sheet allowance for losses . . . . . . . . . . . . . (48) (41) (89) (886) (975)
Total on-balance sheet, net . . . . . . . . . . . . . . . . . . . . . 35,726 73,609 109,335 14,818 124,153
Off-balance sheet:
In-school . . . . . . . . . . . . . . . . . . . . . . . . . . . . . . . 1,004 — 1,004 3,117 4,121
Grace and repayment . . . . . . . . . . . . . . . . . . . . . . . 8,334 15,968 24,302 11,082 35,384
Total off-balance sheet, gross . . . . . . . . . . . . . . . . . . . 9,338 15,968 25,306 14,199 39,505
Off-balance sheet unamortized premium/(discount) . . . . 154 482 636 (355) 281
Off-balance sheet allowance for losses . . . . . . . . . . . . (20) (9) (29) (334) (363)
Total off-balance sheet, net . . . . . . . . . . . . . . . . . . . . 9,472 16,441 25,913 13,510 39,423
Total Managed . . . . . . . . . . . . . . . . . . . . . . . . . . . . . $45,198 $90,050 $135,248 $28,328 $163,576
% of on-balance sheet FFELP. . . . . . . . . . . . . . . . . . . 33% 67% 100%
% of Managed FFELP . . . . . . . . . . . . . . . . . . . . . . . . 33% 67% 100%
% of total . . . . . . . . . . . . . . . . . . . . . . . . . . . . . . . . 28% 55% 83% 17% 100%
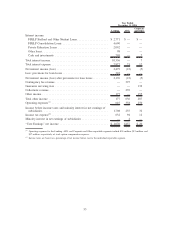
FFELP
Stafford and
Other
(1)
FFELP
Consolidation
Loans
Total
FFELP
Private
Education
Loans Total
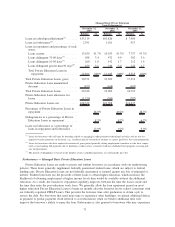
December 31, 2006
On-balance sheet:
In-school . . . . . . . . . . . . . . . . . . . . . . . . . . . . . . . $ 9,745 $ — $ 9,745 $ 4,353 $ 14,098
Grace and repayment . . . . . . . . . . . . . . . . . . . . . . . 14,530 60,348 74,878 6,075 80,953
Total on-balance sheet, gross . . . . . . . . . . . . . . . . . . . 24,275 60,348 84,623 10,428 95,051
On-balance sheet unamortized premium/(discount) . . . . 575 988 1,563 (365) 1,198
On-balance sheet allowance for losses . . . . . . . . . . . . . (9) (12) (21) (308) (329)
Total on-balance sheet, net . . . . . . . . . . . . . . . . . . . . . 24,841 61,324 86,165 9,755 95,920
Off-balance sheet:
In-school . . . . . . . . . . . . . . . . . . . . . . . . . . . . . . . 2,047 — 2,047 3,892 5,939
Grace and repayment . . . . . . . . . . . . . . . . . . . . . . . 12,747 17,817 30,564 9,330 39,894
Total off-balance sheet, gross . . . . . . . . . . . . . . . . . . . 14,794 17,817 32,611 13,222 45,833
Off-balance sheet unamortized premium/(discount) . . . . 244 497 741 (303) 438
Off-balance sheet allowance for losses . . . . . . . . . . . . (10) (3) (13) (86) (99)
Total off-balance sheet, net . . . . . . . . . . . . . . . . . . . . 15,028 18,311 33,339 12,833 46,172
Total Managed . . . . . . . . . . . . . . . . . . . . . . . . . . . . . $39,869 $79,635 $119,504 $22,588 $142,092
% of on-balance sheet FFELP. . . . . . . . . . . . . . . . . . . 29% 71% 100%
% of Managed FFELP . . . . . . . . . . . . . . . . . . . . . . . . 33% 67% 100%
% of total . . . . . . . . . . . . . . . . . . . . . . . . . . . . . . . . 28% 56% 84% 16% 100%
(1)
FFELP category is primarily Stafford loans and also includes federally insured PLUS and HEAL loans.
61