Sallie Mae 2007 Annual Report Download - page 202
Download and view the complete annual report
Please find page 202 of the 2007 Sallie Mae annual report below. You can navigate through the pages in the report by either clicking on the pages listed below, or by using the keyword search tool below to find specific information within the annual report.-
 1
1 -
2
-
3
-
4
-
5
-
6
-
7
-
8
-
9
-
10
-
11
-
12
-
13
-
14
-
15
-
16
-
17
-
18
-
19
-
20
-
21
-
22
-
23
-
24
-
25
-
26
-
27
-
28
-
29
-
30
-
31
-
32
-
33
-
34
-
35
-
36
-
37
-
38
-
39
-
40
-
41
-
42
-
43
-
44
-
45
-
46
-
47
-
48
-
49
-
50
-
51
-
52
-
53
-
54
-
55
-
56
-
57
-
58
-
59
-
60
-
61
-
62
-
63
-
64
-
65
-
66
-
67
-
68
-
69
-
70
-
71
-
72
-
73
-
74
-
75
-
76
-
77
-
78
-
79
-
80
-
81
-
82
-
83
-
84
-
85
-
86
-
87
-
88
-
89
-
90
-
91
-
92
-
93
-
94
-
95
-
96
-
97
-
98
-
99
-
100
-
101
-
102
-
103
-
104
-
105
-
106
-
107
-
108
-
109
-
110
-
111
-
112
-
113
-
114
-
115
-
116
-
117
-
118
-
119
-
120
-
121
-
122
-
123
-
124
-
125
-
126
-
127
-
128
-
129
-
130
-
131
-
132
-
133
-
134
-
135
-
136
-
137
-
138
-
139
-
140
-
141
-
142
-
143
-
144
-
145
-
146
-
147
-
148
-
149
-
150
-
151
-
152
-
153
-
154
-
155
-
156
-
157
-
158
-
159
-
160
-
161
-
162
-
163
-
164
-
165
-
166
-
167
-
168
-
169
-
170
-
171
-
172
-
173
-
174
-
175
-
176
-
177
-
178
-
179
-
180
-
181
-
182
-
183
-
184
-
185
-
186
-
187
-
188
-
189
-
190
-
191
-
 192
192 -
 193
193 -
 194
194 -
 195
195 -
 196
196 -
 197
197 -
 198
198 -
 199
199 -
 200
200 -
 201
201 -
 202
202 -
 203
203 -
 204
204 -
 205
205 -
 206
206 -
 207
207 -
 208
208 -
 209
209 -
 210
210 -
 211
211 -
 212
212 -
213
-
214
-
215
-
216
-
217
-
218
-
219
 |
 |

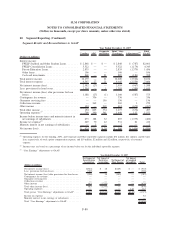
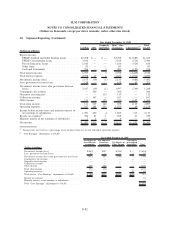
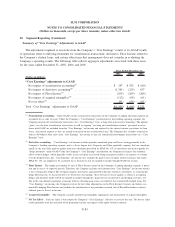
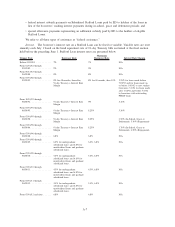
20. Segment Reporting (Continued)
Lending APG
Corporate
and Other
Total “Core
Earnings” Adjustments
(3)
Total
GAAP
Year Ended December 31, 2006
(Dollars in millions)
Interest income:
FFELP Stafford and Other Student Loans . . . . . . . . $ 2,771 $ — $ — $ 2,771 $(1,362) $1,409
FFELP Consolidation Loans . . . . . . . . . . . . . . . . . 4,690 — — 4,690 (1,144) 3,546
Private Education Loans . . . . . . . . . . . . . . . . . . . . 2,092 — — 2,092 (1,071) 1,021
Otherloans............................. 98 — — 98 — 98
Cash and investments . . . . . . . . . . . . . . . . . . . . . . 705 — 7 712 (209) 503
Total interest income . . . . . . . . . . . . . . . . . . . . . . . . 10,356 — 7 10,363 (3,786) 6,577
Total interest expense . . . . . . . . . . . . . . . . . . . . . . . 7,877 23 12 7,912 (2,789) 5,123
Net interest income (loss). . . . . . . . . . . . . . . . . . . . . 2,479 (23) (5) 2,451 (997) 1,454
Less: provisions for loan losses. . . . . . . . . . . . . . . . . 303 — — 303 (16) 287
Net interest income (loss) after provisions for loan
losses . . . . . . . . . . . . . . . . . . . . . . . . . . . . . . . . . 2,176 (23) (5) 2,148 (981) 1,167
Contingency fee revenue . . . . . . . . . . . . . . . . . . . . . — 397 — 397 — 397
Guarantor servicing fees . . . . . . . . . . . . . . . . . . . . . — — 132 132 — 132
Collections revenue . . . . . . . . . . . . . . . . . . . . . . . . . — 239 — 239 1 240
Other income . . . . . . . . . . . . . . . . . . . . . . . . . . . . . 177 — 155 332 1,073 1,405
Total other income . . . . . . . . . . . . . . . . . . . . . . . . . 177 636 287 1,100 1,074 2,174
Operating expenses
(1)
. . . . . . . . . . . . . . . . . . . . . . . 645 358 250 1,253 93 1,346
Income before income taxes and minority interest in
net earnings of subsidiaries . . . . . . . . . . . . . . . . . . 1,708 255 32 1,995 — 1,995
Income tax expense
(2)
....................... 632 94 12 738 96 834
Minority interest in net earnings of subsidiaries . . . . . — 4 — 4 — 4
Net income . . . . . . . . . . . . . . . . . . . . . . . . . . . . . . $ 1,076 $157 $ 20 $ 1,253 $ (96) $1,157
(1)
Operating expenses for the Lending, APG, and Corporate and Other reportable segments include $34 million, $12 million, and $17 mil-
lion, respectively, of stock option compensation expense.
(2)
Income taxes are based on a percentage of net income before tax for the individual reportable segment.
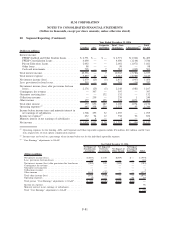
(3)
“Core Earnings” adjustments to GAAP:
Net Impact of
Securitization
Accounting
Net Impact of
Derivative
Accounting
Net Impact of
Floor Income
Net Impact
of Acquired
Intangibles Total
Year Ended December 31, 2006
(Dollars in millions)
Net interest income (loss) . . . .................... $(897) $ 109 $(209) $ — $ (997)
Less: provisions for loan losses ................... (16) — — — (16)
Net interest income (loss) after provisions for loan losses . . (881) 109 (209) — (981)
Contingency fee revenue ........................ — — — — —
Guarantor servicing fees ........................ — — — — —
Collections revenue . . ......................... 1 — — — 1
Other income . .............................. 1,411 (338) — — 1,073
Total other income (loss) . . . .................... 1,412 (338) — — 1,074
Operating expenses . . ......................... (1) — — 94 93
Total pre-tax “Core Earnings” adjustments to GAAP . . . . . . $ 532 $(229) $(209) $(94) —
Income tax expense . . ......................... 96
Minority interest in net earnings of subsidiaries ......... —
Total “Core Earnings” adjustments to GAAP . . ......... $ (96)
F-81
SLM CORPORATION
NOTES TO CONSOLIDATED FINANCIAL STATEMENTS
(Dollars in thousands, except per share amounts, unless otherwise stated)