Sallie Mae 2007 Annual Report Download - page 156
Download and view the complete annual report
Please find page 156 of the 2007 Sallie Mae annual report below. You can navigate through the pages in the report by either clicking on the pages listed below, or by using the keyword search tool below to find specific information within the annual report.-
 1
1 -
2
-
3
-
4
-
5
-
6
-
7
-
8
-
9
-
10
-
11
-
12
-
13
-
14
-
15
-
16
-
17
-
18
-
19
-
20
-
21
-
22
-
23
-
24
-
25
-
26
-
27
-
28
-
29
-
30
-
31
-
32
-
33
-
34
-
35
-
36
-
37
-
38
-
39
-
40
-
41
-
42
-
43
-
44
-
45
-
46
-
47
-
48
-
49
-
50
-
51
-
52
-
53
-
54
-
55
-
56
-
57
-
58
-
59
-
60
-
61
-
62
-
63
-
64
-
65
-
66
-
67
-
68
-
69
-
70
-
71
-
72
-
73
-
74
-
75
-
76
-
77
-
78
-
79
-
80
-
81
-
82
-
83
-
84
-
85
-
86
-
87
-
88
-
89
-
90
-
91
-
92
-
93
-
94
-
95
-
96
-
97
-
98
-
99
-
100
-
101
-
102
-
103
-
104
-
105
-
106
-
107
-
108
-
109
-
110
-
111
-
112
-
113
-
114
-
115
-
116
-
117
-
118
-
119
-
120
-
121
-
122
-
123
-
124
-
125
-
126
-
127
-
128
-
129
-
130
-
131
-
132
-
133
-
134
-
135
-
136
-
137
-
138
-
139
-
140
-
141
-
142
-
143
-
144
-
145
-
 146
146 -
 147
147 -
 148
148 -
 149
149 -
 150
150 -
 151
151 -
 152
152 -
 153
153 -
 154
154 -
 155
155 -
 156
156 -
 157
157 -
 158
158 -
 159
159 -
 160
160 -
 161
161 -
 162
162 -
 163
163 -
 164
164 -
 165
165 -
 166
166 -
167
-
168
-
169
-
170
-
171
-
172
-
173
-
174
-
175
-
176
-
177
-
178
-
179
-
180
-
181
-
182
-
183
-
184
-
185
-
186
-
187
-
188
-
189
-
190
-
191
-
192
-
193
-
194
-
195
-
196
-
197
-
198
-
199
-
200
-
201
-
202
-
203
-
204
-
205
-
206
-
207
-
208
-
209
-
210
-
211
-
212
-
213
-
214
-
215
-
216
-
217
-
218
-
219
 |
 |

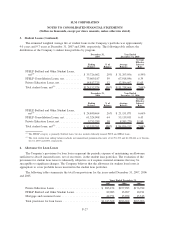
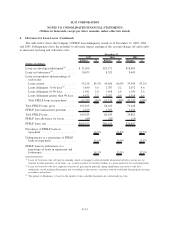
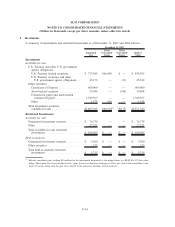
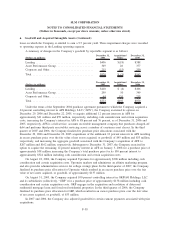
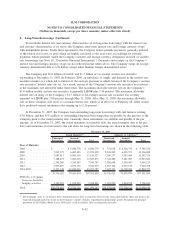
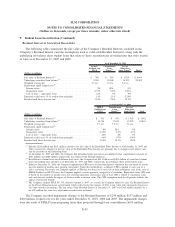
5. Investments (Continued)
Amortized
Cost
Gross
Unrealized
Gains
Gross
Unrealized
Losses
Market
Value
December 31, 2006
Investments
Available-for-sale
U.S. Treasury and other U.S. government
agency obligations:
U.S. Treasury backed securities......... $1,292,121 $137,317 $ — $1,429,438
U.S. Treasury securities and other
U.S. government agency obligations . . . 41,237 — (536) 40,701
Other securities:
Asset-backed securities ............... 46,291 159 — 46,450
Commercial paper and asset-backed
commercial paper ................. 943,306 — — 943,306
Other ............................ 4,177 50 (1) 4,226
Total investment securities available-for-
sale ............................. $2,327,132 $137,526
(1)
$ (537) $2,464,121
Restricted Investments
Available-for sale
U.S. Treasury and other U.S. government
agency obligations .................. $ 77,837 $ 47 $(1,185) $ 76,699
Third-party repurchase agreements ........ 83,800 — — 83,800
Guaranteed investment contracts .......... 91,662 — — 91,662
Corporate notes . ..................... 9,933 — (28) 9,905
Asset-backed securities................. 28,209 55 — 28,264
Other .............................. 13,373 74 — 13,447
Total available-for-sale restricted
investments . . ..................... $ 304,814 $ 176 $(1,213) $ 303,777
Held-to-maturity
Guaranteed investment contracts .......... $ 7,190 $ — $ — $ 7,190
Other securities . ..................... 406 — — 406
Total held-to-maturity restricted
investments . . ..................... $ 7,596 $ — $ — $ 7,596
(1)
Includes unrealized gains totaling $8 million for the investments designated as the hedged items in a SFAS No. 133 fair value hedge. These
gains have been recorded in the “gains (losses) on derivative hedging activities, net” line in the consolidated statements of income along with
the gain (loss) related to the derivatives hedging such investments.
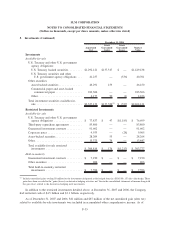
In addition to the restricted investments detailed above, at December 31, 2007 and 2006, the Company
had restricted cash of $4.5 billion and $3.1 billion, respectively.
As of December 31, 2007 and 2006, $41 million and $87 million of the net unrealized gain (after tax)
related to available-for-sale investments was included in accumulated other comprehensive income. As of
F-35
SLM CORPORATION
NOTES TO CONSOLIDATED FINANCIAL STATEMENTS
(Dollars in thousands, except per share amounts, unless otherwise stated)