Sallie Mae 2007 Annual Report Download - page 101
Download and view the complete annual report
Please find page 101 of the 2007 Sallie Mae annual report below. You can navigate through the pages in the report by either clicking on the pages listed below, or by using the keyword search tool below to find specific information within the annual report.-
 1
1 -
2
-
3
-
4
-
5
-
6
-
7
-
8
-
9
-
10
-
11
-
12
-
13
-
14
-
15
-
16
-
17
-
18
-
19
-
20
-
21
-
22
-
23
-
24
-
25
-
26
-
27
-
28
-
29
-
30
-
31
-
32
-
33
-
34
-
35
-
36
-
37
-
38
-
39
-
40
-
41
-
42
-
43
-
44
-
45
-
46
-
47
-
48
-
49
-
50
-
51
-
52
-
53
-
54
-
55
-
56
-
57
-
58
-
59
-
60
-
61
-
62
-
63
-
64
-
65
-
66
-
67
-
68
-
69
-
70
-
71
-
72
-
73
-
74
-
75
-
76
-
77
-
78
-
79
-
80
-
81
-
82
-
83
-
84
-
85
-
86
-
87
-
88
-
89
-
90
-
 91
91 -
 92
92 -
 93
93 -
 94
94 -
 95
95 -
 96
96 -
 97
97 -
 98
98 -
 99
99 -
 100
100 -
 101
101 -
 102
102 -
 103
103 -
 104
104 -
 105
105 -
 106
106 -
 107
107 -
 108
108 -
 109
109 -
 110
110 -
 111
111 -
112
-
113
-
114
-
115
-
116
-
117
-
118
-
119
-
120
-
121
-
122
-
123
-
124
-
125
-
126
-
127
-
128
-
129
-
130
-
131
-
132
-
133
-
134
-
135
-
136
-
137
-
138
-
139
-
140
-
141
-
142
-
143
-
144
-
145
-
146
-
147
-
148
-
149
-
150
-
151
-
152
-
153
-
154
-
155
-
156
-
157
-
158
-
159
-
160
-
161
-
162
-
163
-
164
-
165
-
166
-
167
-
168
-
169
-
170
-
171
-
172
-
173
-
174
-
175
-
176
-
177
-
178
-
179
-
180
-
181
-
182
-
183
-
184
-
185
-
186
-
187
-
188
-
189
-
190
-
191
-
192
-
193
-
194
-
195
-
196
-
197
-
198
-
199
-
200
-
201
-
202
-
203
-
204
-
205
-
206
-
207
-
208
-
209
-
210
-
211
-
212
-
213
-
214
-
215
-
216
-
217
-
218
-
219
 |
 |

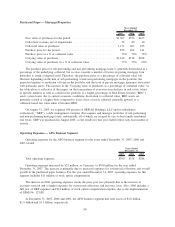
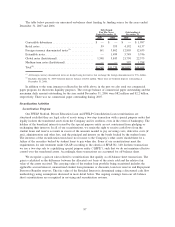
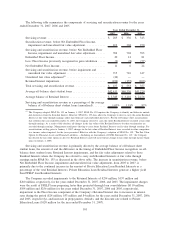
Off-Balance Sheet Net Assets
The following table summarizes our off-balance sheet net assets at December 31, 2007 and 2006 on a
basis equivalent to our GAAP on-balance sheet trusts, which presents the assets and liabilities in the off-
balance sheet trusts as if they were being accounted for on-balance sheet rather than off-balance sheet. This
presentation, therefore, includes a theoretical calculation of the premiums on student loans, the allowance for
loan losses, and the discounts and deferred financing costs on the debt. This presentation is not, nor is it
intended to be, a liquidation basis of accounting. (See also “LENDING BUSINESS SEGMENT — Summary
of our Managed Student Loan Portfolio — Ending Balances (net of allowance for loan losses)” and
“LIQUIDITY AND CAPITAL RESOURCES — Managed Borrowings — Ending Balances,” earlier in this
section.)
December 31,
2007
December 31,
2006
Off-Balance Sheet Assets:
Total student loans, net ................................... $39,423 $46,172
Restricted cash and investments ............................ 2,706 4,269
Accrued interest receivable ................................ 1,413 1,467
Total off-balance sheet assets ................................ 43,542 51,908
Off-Balance Sheet Liabilities:
Debt, par value ......................................... 42,192 50,058
Debt unamortized discount and deferred issuance costs ........... (104) (193)
Total debt............................................. 42,088 49,865
Accrued interest payable .................................. 305 405
Total off-balance sheet liabilities.............................. 42,393 50,270
Off-Balance Sheet Net Assets ............................... $ 1,149 $ 1,638
Servicing and Securitization Revenue
Servicing and securitization revenue, the ongoing revenue from securitized loan pools accounted for off-
balance sheet as QSPEs, includes the interest earned on the Residual Interest and the revenue we receive for
servicing the loans in the securitization trusts. Interest income recognized on the Residual Interest is based on
our anticipated yield determined by estimating future cash flows each quarter.
100