Sallie Mae 2007 Annual Report Download - page 90
Download and view the complete annual report
Please find page 90 of the 2007 Sallie Mae annual report below. You can navigate through the pages in the report by either clicking on the pages listed below, or by using the keyword search tool below to find specific information within the annual report.-
 1
1 -
2
-
3
-
4
-
5
-
6
-
7
-
8
-
9
-
10
-
11
-
12
-
13
-
14
-
15
-
16
-
17
-
18
-
19
-
20
-
21
-
22
-
23
-
24
-
25
-
26
-
27
-
28
-
29
-
30
-
31
-
32
-
33
-
34
-
35
-
36
-
37
-
38
-
39
-
40
-
41
-
42
-
43
-
44
-
45
-
46
-
47
-
48
-
49
-
50
-
51
-
52
-
53
-
54
-
55
-
56
-
57
-
58
-
59
-
60
-
61
-
62
-
63
-
64
-
65
-
66
-
67
-
68
-
69
-
70
-
71
-
72
-
73
-
74
-
75
-
76
-
77
-
78
-
79
-
 80
80 -
 81
81 -
 82
82 -
 83
83 -
 84
84 -
 85
85 -
 86
86 -
 87
87 -
 88
88 -
 89
89 -
 90
90 -
 91
91 -
 92
92 -
 93
93 -
 94
94 -
 95
95 -
 96
96 -
 97
97 -
 98
98 -
 99
99 -
 100
100 -
101
-
102
-
103
-
104
-
105
-
106
-
107
-
108
-
109
-
110
-
111
-
112
-
113
-
114
-
115
-
116
-
117
-
118
-
119
-
120
-
121
-
122
-
123
-
124
-
125
-
126
-
127
-
128
-
129
-
130
-
131
-
132
-
133
-
134
-
135
-
136
-
137
-
138
-
139
-
140
-
141
-
142
-
143
-
144
-
145
-
146
-
147
-
148
-
149
-
150
-
151
-
152
-
153
-
154
-
155
-
156
-
157
-
158
-
159
-
160
-
161
-
162
-
163
-
164
-
165
-
166
-
167
-
168
-
169
-
170
-
171
-
172
-
173
-
174
-
175
-
176
-
177
-
178
-
179
-
180
-
181
-
182
-
183
-
184
-
185
-
186
-
187
-
188
-
189
-
190
-
191
-
192
-
193
-
194
-
195
-
196
-
197
-
198
-
199
-
200
-
201
-
202
-
203
-
204
-
205
-
206
-
207
-
208
-
209
-
210
-
211
-
212
-
213
-
214
-
215
-
216
-
217
-
218
-
219
 |
 |

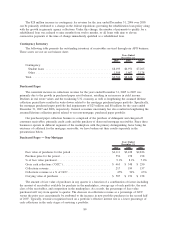
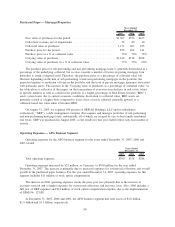
The $28 million increase in contingency fee revenue for the year ended December 31, 2006 over 2005
can be primarily attributed to a change in the federal regulations governing the rehabilitation loan policy along
with the growth in guaranty agency collections. Under this change, the number of payments to qualify for a
rehabilitated loan was reduced to nine months from twelve months, so all loans with nine to eleven
consecutive payments at the time of change immediately qualified as a rehabilitated loan.
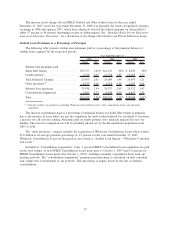
Contingency Inventory
The following table presents the outstanding inventory of receivables serviced through our APG business.
These assets are not on our balance sheet.
2007 2006 2005
Years Ended
December 31,
Contingency:
Student loans ......................................... $8,195 $6,971 $7,205
Other ............................................... 1,509 1,667 2,178
Total.................................................. $9,704 $8,638 $9,383
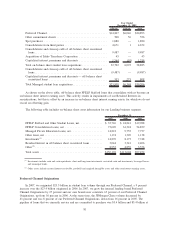
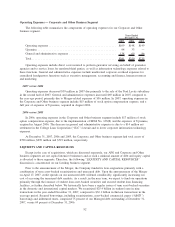
Purchased Paper
The consistent increase in collections revenue for the years ended December 31, 2005 to 2007 was
primarily due to the growth in purchased paper asset balances, resulting in an increase in yield income.
Declines in real estate values and the weakening U.S. economy as well as lengthening the assumed lifetime
collection period have resulted in write-downs related to the mortgage purchased paper portfolio. Specifically,
the mortgage purchased paper portfolio had impairments of $25 million and $8 million for the years ended
December 31, 2007 and 2006, respectively. General economic uncertainty has also resulted in lengthening the
assumed lifetime collection period related to our non-mortgage, purchased paper portfolio.
Our purchased paper collection business is comprised of the purchase of delinquent and charged-off
consumer receivables, primarily credit cards and the purchase of distressed mortgage receivables. Since these
businesses operate in different segments of the marketplace with the primary distinguishing factor being the
existence of collateral for the mortgage receivable, we have broken out their results separately in the
presentations below.
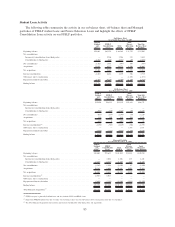
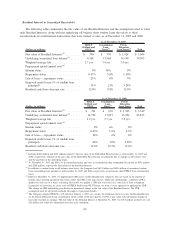
Purchased Paper — Non-Mortgage
2007 2006 2005
Years Ended
December 31,
Face value of purchases for the period ......................... $6,111 $3,438 $2,826
Purchase price for the period ................................ 556 278 198
% of face value purchased .................................. 9.1% 8.1% 7.0%
Gross cash collections (“GCC”) .............................. $ 463 $ 348 $ 250
Collections revenue ....................................... 217 199 157
Collections revenue as a % of GCC ........................... 47% 56% 63%
Carrying value of purchases ................................ $ 587 $ 274 $ 158
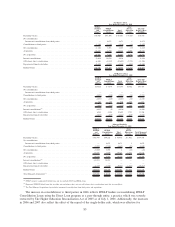
The amount of face value of purchases in any quarter is a function of a combination of factors including
the amount of receivables available for purchase in the marketplace, average age of each portfolio, the asset
class of the receivables, and competition in the marketplace. As a result, the percentage of face value
purchased will vary from quarter to quarter. The decrease in collections revenue as a percentage of GCC
versus the prior year can primarily be attributed to the increase in new portfolio purchases in the second half
of 2007. Typically, revenue recognition based on a portfolio’s effective interest rate is a lower percentage of
cash collections in the early stages of servicing a portfolio.
89