Sallie Mae 2007 Annual Report Download - page 97
Download and view the complete annual report
Please find page 97 of the 2007 Sallie Mae annual report below. You can navigate through the pages in the report by either clicking on the pages listed below, or by using the keyword search tool below to find specific information within the annual report.-
 1
1 -
2
-
3
-
4
-
5
-
6
-
7
-
8
-
9
-
10
-
11
-
12
-
13
-
14
-
15
-
16
-
17
-
18
-
19
-
20
-
21
-
22
-
23
-
24
-
25
-
26
-
27
-
28
-
29
-
30
-
31
-
32
-
33
-
34
-
35
-
36
-
37
-
38
-
39
-
40
-
41
-
42
-
43
-
44
-
45
-
46
-
47
-
48
-
49
-
50
-
51
-
52
-
53
-
54
-
55
-
56
-
57
-
58
-
59
-
60
-
61
-
62
-
63
-
64
-
65
-
66
-
67
-
68
-
69
-
70
-
71
-
72
-
73
-
74
-
75
-
76
-
77
-
78
-
79
-
80
-
81
-
82
-
83
-
84
-
85
-
86
-
 87
87 -
 88
88 -
 89
89 -
 90
90 -
 91
91 -
 92
92 -
 93
93 -
 94
94 -
 95
95 -
 96
96 -
 97
97 -
 98
98 -
 99
99 -
 100
100 -
 101
101 -
 102
102 -
 103
103 -
 104
104 -
 105
105 -
 106
106 -
 107
107 -
108
-
109
-
110
-
111
-
112
-
113
-
114
-
115
-
116
-
117
-
118
-
119
-
120
-
121
-
122
-
123
-
124
-
125
-
126
-
127
-
128
-
129
-
130
-
131
-
132
-
133
-
134
-
135
-
136
-
137
-
138
-
139
-
140
-
141
-
142
-
143
-
144
-
145
-
146
-
147
-
148
-
149
-
150
-
151
-
152
-
153
-
154
-
155
-
156
-
157
-
158
-
159
-
160
-
161
-
162
-
163
-
164
-
165
-
166
-
167
-
168
-
169
-
170
-
171
-
172
-
173
-
174
-
175
-
176
-
177
-
178
-
179
-
180
-
181
-
182
-
183
-
184
-
185
-
186
-
187
-
188
-
189
-
190
-
191
-
192
-
193
-
194
-
195
-
196
-
197
-
198
-
199
-
200
-
201
-
202
-
203
-
204
-
205
-
206
-
207
-
208
-
209
-
210
-
211
-
212
-
213
-
214
-
215
-
216
-
217
-
218
-
219
 |
 |

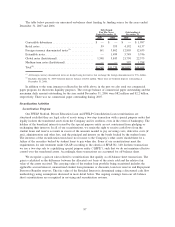
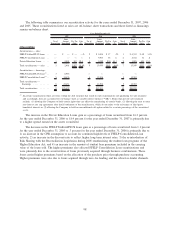
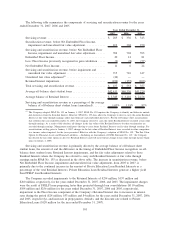
Managed Borrowings
The following tables present the ending and average balances and average interest rates of our Managed
borrowings for the years ended December 31, 2007, 2006 and 2005. The average interest rates include
derivatives that are economically hedging the underlying debt but do not qualify for hedge accounting
treatment under SFAS No. 133. (See “BUSINESS SEGMENTS — Limitations of ‘Core Earnings’ — Pre-tax
Differences between ‘Core Earnings’ and GAAP by Business Segment — Derivative Accounting — Reclassifi-
cation of Realized Gains (Losses) on Derivative and Hedging Activities.”)
Ending Balances
Short
Term
Long
Term
Total
Managed
Basis
Short
Term
Long
Term
Total
Managed
Basis
Short
Term
Long
Term
Total
Managed
Basis
Ending Balance Ending Balance Ending Balance
2007 2006 2005
Years Ended December 31,
Unsecured borrowings . . . . . . . . . . . . $ 8,551 $ 36,796 $ 45,347 $3,187 $ 45,501 $ 48,688 $3,784 $ 37,944 $ 41,728
Indentured trusts (on-balance sheet) . . . . 100 2,481 2,581 93 2,852 2,945 23 3,372 3,395
ABCP facilities (on-balance sheet) . . . . . 25,960 67 26,027 — 4,953 4,953 — 4,960 4,960
Securitizations (on-balance sheet) . . . . . — 68,048 68,048 — 50,147 50,147 — 42,275 42,275
Securitizations (off-balance sheet) . . . . . — 42,088 42,088 — 49,865 49,865 — 43,138 43,138
Other . . . . . . . . . . . . . . . . . . . . . . . 1,342 — 1,342 248 — 248 3 — 3
Total . . . . . . . . . . . . . . . . . . . . . . . $35,953 $149,480 $185,433 $3,528 $153,318 $156,846 $3,810 $131,689 $135,499
Average Balances
Average
Balance
Average
Rate
Average
Balance
Average
Rate
Average
Balance
Average
Rate
2007 2006 2005
Years Ended December 31,
Unsecured borrowings . ............................. 46,261 5.58% 43,755 5.50% 37,841 3.98%
Indentured trusts (on-balance sheet) . . . ................... 2,768 4.90 3,252 4.57 4,782 3.27
ABCP facilities (on-balance sheet) . . . ................... 13,938 5.85 4,874 5.36 4,533 3.64
Securitizations (on-balance sheet) ....................... 62,765 5.55 43,310 5.40 35,180 3.73
Securitizations (off-balance sheet) ....................... 45,733 5.68 50,112 5.49 44,545 3.77
Other ......................................... 637 4.85 172 5.03 139 3.23
Total . . . ....................................... $172,102 5.60% $145,475 5.44% $127,020 3.80%
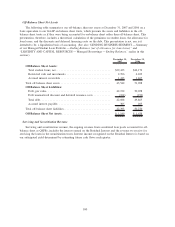
Unsecured On-Balance Sheet Financing Activities
The following table presents the senior unsecured credit ratings assigned by major rating agencies as of
February 28, 2008. Each of the rating agencies has the Company’s current ratings on review for potential
downgrade.
S&P Moody’s Fitch
Short-term unsecured debt................................... A-3 P-2 F3
Long-term senior unsecured debt .............................. BBB⫺Baa1 BBB
96