Sallie Mae 2007 Annual Report Download - page 193
Download and view the complete annual report
Please find page 193 of the 2007 Sallie Mae annual report below. You can navigate through the pages in the report by either clicking on the pages listed below, or by using the keyword search tool below to find specific information within the annual report.-
 1
1 -
2
-
3
-
4
-
5
-
6
-
7
-
8
-
9
-
10
-
11
-
12
-
13
-
14
-
15
-
16
-
17
-
18
-
19
-
20
-
21
-
22
-
23
-
24
-
25
-
26
-
27
-
28
-
29
-
30
-
31
-
32
-
33
-
34
-
35
-
36
-
37
-
38
-
39
-
40
-
41
-
42
-
43
-
44
-
45
-
46
-
47
-
48
-
49
-
50
-
51
-
52
-
53
-
54
-
55
-
56
-
57
-
58
-
59
-
60
-
61
-
62
-
63
-
64
-
65
-
66
-
67
-
68
-
69
-
70
-
71
-
72
-
73
-
74
-
75
-
76
-
77
-
78
-
79
-
80
-
81
-
82
-
83
-
84
-
85
-
86
-
87
-
88
-
89
-
90
-
91
-
92
-
93
-
94
-
95
-
96
-
97
-
98
-
99
-
100
-
101
-
102
-
103
-
104
-
105
-
106
-
107
-
108
-
109
-
110
-
111
-
112
-
113
-
114
-
115
-
116
-
117
-
118
-
119
-
120
-
121
-
122
-
123
-
124
-
125
-
126
-
127
-
128
-
129
-
130
-
131
-
132
-
133
-
134
-
135
-
136
-
137
-
138
-
139
-
140
-
141
-
142
-
143
-
144
-
145
-
146
-
147
-
148
-
149
-
150
-
151
-
152
-
153
-
154
-
155
-
156
-
157
-
158
-
159
-
160
-
161
-
162
-
163
-
164
-
165
-
166
-
167
-
168
-
169
-
170
-
171
-
172
-
173
-
174
-
175
-
176
-
177
-
178
-
179
-
180
-
181
-
182
-
 183
183 -
 184
184 -
 185
185 -
 186
186 -
 187
187 -
 188
188 -
 189
189 -
 190
190 -
 191
191 -
 192
192 -
 193
193 -
 194
194 -
 195
195 -
 196
196 -
 197
197 -
 198
198 -
 199
199 -
 200
200 -
 201
201 -
 202
202 -
 203
203 -
204
-
205
-
206
-
207
-
208
-
209
-
210
-
211
-
212
-
213
-
214
-
215
-
216
-
217
-
218
-
219
 |
 |

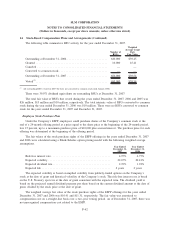
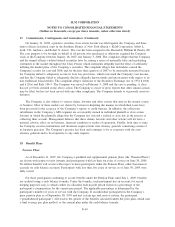
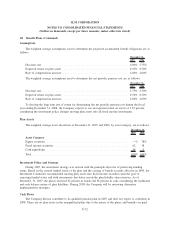
18. Benefit Plans (Continued)
Assumptions
The weighted average assumptions used to determine the projected accumulated benefit obligations are as
follows:
2007 2006
December 31,
Discount rate ....................................................... 6.00% 5.75%
Expected return on plan assets .......................................... 8.50% 8.50%
Rate of compensation increase .......................................... 4.00% 4.00%
The weighted average assumptions used to determine the net periodic pension cost are as follows:
2007 2006
December 31,
Discount rate ....................................................... 5.75% 5.50%
Expected return on plan assets .......................................... 8.50% 8.50%
Rate of compensation increase .......................................... 4.00% 4.00%
To develop the long term rate of return for determining the net periodic pension cost during the fiscal
year ending December 31, 2008, the Company expects to use an expected return on assets of 5.25 percent
considering the investment policy changes moving plan assets into all fixed income investments.
Plan Assets
The weighted average asset allocations at December 31, 2007 and 2006, by asset category, are as follows:
2007 2006
December 31,
Asset Category
Equity securities ..................................................... —% 78%
Fixed income securities ................................................ 62 18
Cash equivalents ..................................................... 38 4
Total ............................................................. 100% 100%
Investment Policy and Strategy
During 2007, the investment strategy was revised with the principle objective of preserving funding
status. Based on the current funded status of the plan and the ceasing of benefit accruals effective in 2009, the
Investment Committee recommended moving plan assets into fixed income securities with the goal of
removing funded status risk with investments that better match the plan liability characteristics. As of
December 31, 2007, the plan is invested 62 percent in bonds and 38 percent in cash, considering the traditional
and cash balance nature of plan liabilities. During 2008, the Company will be reviewing alternative
implementation strategies.
Cash Flows
The Company did not contribute to its qualified pension plan in 2007 and does not expect to contribute in
2008. There are no plan assets in the nonqualified plans due to the nature of the plans, and benefits are paid
F-72
SLM CORPORATION
NOTES TO CONSOLIDATED FINANCIAL STATEMENTS
(Dollars in thousands, except per share amounts, unless otherwise stated)