Sallie Mae 2007 Annual Report Download - page 46
Download and view the complete annual report
Please find page 46 of the 2007 Sallie Mae annual report below. You can navigate through the pages in the report by either clicking on the pages listed below, or by using the keyword search tool below to find specific information within the annual report.-
 1
1 -
2
-
3
-
4
-
5
-
6
-
7
-
8
-
9
-
10
-
11
-
12
-
13
-
14
-
15
-
16
-
17
-
18
-
19
-
20
-
21
-
22
-
23
-
24
-
25
-
26
-
27
-
28
-
29
-
30
-
31
-
32
-
33
-
34
-
35
-
 36
36 -
 37
37 -
 38
38 -
 39
39 -
 40
40 -
 41
41 -
 42
42 -
 43
43 -
 44
44 -
 45
45 -
 46
46 -
 47
47 -
 48
48 -
 49
49 -
 50
50 -
 51
51 -
 52
52 -
 53
53 -
 54
54 -
 55
55 -
 56
56 -
57
-
58
-
59
-
60
-
61
-
62
-
63
-
64
-
65
-
66
-
67
-
68
-
69
-
70
-
71
-
72
-
73
-
74
-
75
-
76
-
77
-
78
-
79
-
80
-
81
-
82
-
83
-
84
-
85
-
86
-
87
-
88
-
89
-
90
-
91
-
92
-
93
-
94
-
95
-
96
-
97
-
98
-
99
-
100
-
101
-
102
-
103
-
104
-
105
-
106
-
107
-
108
-
109
-
110
-
111
-
112
-
113
-
114
-
115
-
116
-
117
-
118
-
119
-
120
-
121
-
122
-
123
-
124
-
125
-
126
-
127
-
128
-
129
-
130
-
131
-
132
-
133
-
134
-
135
-
136
-
137
-
138
-
139
-
140
-
141
-
142
-
143
-
144
-
145
-
146
-
147
-
148
-
149
-
150
-
151
-
152
-
153
-
154
-
155
-
156
-
157
-
158
-
159
-
160
-
161
-
162
-
163
-
164
-
165
-
166
-
167
-
168
-
169
-
170
-
171
-
172
-
173
-
174
-
175
-
176
-
177
-
178
-
179
-
180
-
181
-
182
-
183
-
184
-
185
-
186
-
187
-
188
-
189
-
190
-
191
-
192
-
193
-
194
-
195
-
196
-
197
-
198
-
199
-
200
-
201
-
202
-
203
-
204
-
205
-
206
-
207
-
208
-
209
-
210
-
211
-
212
-
213
-
214
-
215
-
216
-
217
-
218
-
219
 |
 |
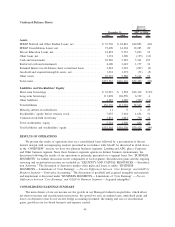
Year Ended December 31, 2007 Compared to Year Ended December 31, 2006
For the year ended December 31, 2007, our net loss was $896 million, or $2.26 diluted loss per share,
compared to net income of $1.2 billion, or $2.63 diluted earnings per share, in the year-ago period. The
effective tax rate in those periods was (86) percent and 42 percent, respectively. The movement in the effective
tax rate was primarily driven by the permanent tax impact of excluding non-taxable gains and losses on equity
forward contracts which are marked to market through earnings under the FASB’s SFAS No. 133. Pre-tax
income decreased by $2.5 billion versus the year ended December 31, 2006 primarily due to a $1.0 billion
increase in net losses on derivative and hedging activities, which was mostly comprised of losses on our equity
forward contracts. Losses on derivative and hedging activities were $1.4 billion for the year ended
December 31, 2007 compared to $339 million for the year ended December 31, 2006.
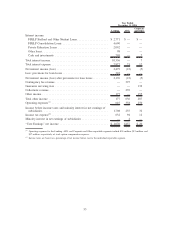
Pre-tax income for the year ended December 31, 2007 also decreased versus the year ended December 31,
2006 due to a $535 million decrease in gains on student loan securitizations. The securitization gain in 2007
was the result of one Private Education Loan securitization that had a pre-tax gain of $367 million or
18.4 percent of the amount securitized. In the year-ago period, there were three Private Education Loan
securitizations that had total pre-tax gains of $830 million or 16.3 percent of the amount securitized. For the
year ended December 31, 2007, servicing and securitization income was $437 million, a $116 million decrease
from the year ended December 31, 2006. This decrease was primarily due to a $97 million increase in
impairment losses which was mainly the result of FFELP Stafford Consolidation Loan activity exceeding
expectations, increased Private Education Consolidation Loan activity, increased Private Education Loan
expected default activity, and an increase in the discount rate used to value the Private Education Loan
Residual Interests (see “LIQUIDITY AND CAPITAL RESOURCES — Residual Interest in Securitized
Receivables”).
Net interest income after provisions for loan losses decreased by $594 million versus the year ended
December 31, 2006. The decrease was due to the year-over-year increase in the provisions for loan losses of
$728 million, which offset the year-over-year $134 million increase in net interest income. The increase in net
interest income was primarily due to an increase of $30.8 billion in the average balance of on-balance sheet
interest earning assets offset by a decrease in the student loan spread, including the impact of Wholesale
Consolidation Loans (see “Student Loan Spread — Student Loan Spread Analysis — On-Balance Sheet”). The
increase in provisions for loan losses relates to higher provision amounts for Private Education Loans, FFELP
loans, and mortgage loans primarily due to a weakening U.S. economy (see “LENDING BUSINESS
SEGMENT — Activity in the Allowance for Private Education Loan Losses; and — Total Provisions for Loan
Losses”).
Fee and other income and collections revenue increased $42 million from $1.11 billion for the year ended
December 31, 2006 to $1.15 billion for the year ended December 31, 2007. Operating expenses increased by
$206 million year-over-year. This increase in operating expenses was primarily due to $56 million in Merger-
related expenses and $23 million in severance costs incurred in 2007. As part of the Company’s cost reduction
efforts, these severance costs were related to the elimination of approximately 350 positions (representing three
percent of the overall employee population) across all areas of the Company. Operating expenses in 2007 also
included $93 million related to a full year of expenses for Upromise compared to $33 million incurred in 2006
subsequent to the August 2006 acquisition of this subsidiary.
Our Managed student loan portfolio grew by $21.5 billion (or 15 percent), from $142.1 billion at
December 31, 2006 to $163.6 billion at December 31, 2007. In 2007 we acquired $40.3 billion of student
loans, an 8 percent increase over the $37.4 billion acquired in the year-ago period. The 2007 acquisitions
included $9.3 billion in Private Education Loans, an 11 percent increase over the $8.4 billion acquired in
2006. In the year ended December 31, 2007, we originated $25.5 billion of student loans through our Preferred
Channel, an increase of 9 percent over the $23.4 billion originated in the year-ago period.
Year Ended December 31, 2006 Compared to Year Ended December 31, 2005
For the year ended December 31, 2006, net income was $1.2 billion ($2.63 diluted earnings per share), a
16 percent decrease from the $1.4 billion in net income ($3.05 diluted earnings per share) for the year ended
45