Sallie Mae 2007 Annual Report Download - page 82
Download and view the complete annual report
Please find page 82 of the 2007 Sallie Mae annual report below. You can navigate through the pages in the report by either clicking on the pages listed below, or by using the keyword search tool below to find specific information within the annual report.-
 1
1 -
2
-
3
-
4
-
5
-
6
-
7
-
8
-
9
-
10
-
11
-
12
-
13
-
14
-
15
-
16
-
17
-
18
-
19
-
20
-
21
-
22
-
23
-
24
-
25
-
26
-
27
-
28
-
29
-
30
-
31
-
32
-
33
-
34
-
35
-
36
-
37
-
38
-
39
-
40
-
41
-
42
-
43
-
44
-
45
-
46
-
47
-
48
-
49
-
50
-
51
-
52
-
53
-
54
-
55
-
56
-
57
-
58
-
59
-
60
-
61
-
62
-
63
-
64
-
65
-
66
-
67
-
68
-
69
-
70
-
71
-
 72
72 -
 73
73 -
 74
74 -
 75
75 -
 76
76 -
 77
77 -
 78
78 -
 79
79 -
 80
80 -
 81
81 -
 82
82 -
 83
83 -
 84
84 -
 85
85 -
 86
86 -
 87
87 -
 88
88 -
 89
89 -
 90
90 -
 91
91 -
 92
92 -
93
-
94
-
95
-
96
-
97
-
98
-
99
-
100
-
101
-
102
-
103
-
104
-
105
-
106
-
107
-
108
-
109
-
110
-
111
-
112
-
113
-
114
-
115
-
116
-
117
-
118
-
119
-
120
-
121
-
122
-
123
-
124
-
125
-
126
-
127
-
128
-
129
-
130
-
131
-
132
-
133
-
134
-
135
-
136
-
137
-
138
-
139
-
140
-
141
-
142
-
143
-
144
-
145
-
146
-
147
-
148
-
149
-
150
-
151
-
152
-
153
-
154
-
155
-
156
-
157
-
158
-
159
-
160
-
161
-
162
-
163
-
164
-
165
-
166
-
167
-
168
-
169
-
170
-
171
-
172
-
173
-
174
-
175
-
176
-
177
-
178
-
179
-
180
-
181
-
182
-
183
-
184
-
185
-
186
-
187
-
188
-
189
-
190
-
191
-
192
-
193
-
194
-
195
-
196
-
197
-
198
-
199
-
200
-
201
-
202
-
203
-
204
-
205
-
206
-
207
-
208
-
209
-
210
-
211
-
212
-
213
-
214
-
215
-
216
-
217
-
218
-
219
 |
 |

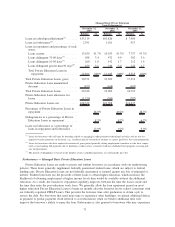
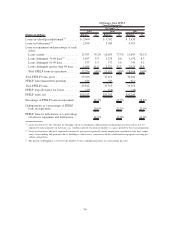
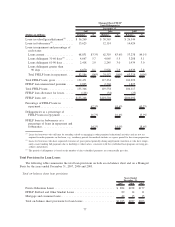
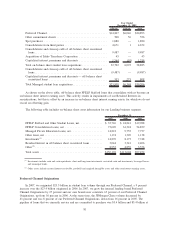
FFELP Private Total
Year Ended
December 31, 2005
Preferred Channel ...................................... $14,847 $6,046 $20,893
Other commitment clients ................................ 500 56 556
Spot purchases ........................................ 1,880 — 1,880
Consolidations from third parties ........................... 4,671 1 4,672
Consolidations and clean-up calls of off-balance sheet securitized
loans .............................................. 9,487 — 9,487
Acquisition of Idaho Transferee Corporation .................. 43 — 43
Capitalized interest, premiums and discounts .................. 1,364 (10) 1,354
Total on-balance sheet student loan acquisitions ................ 32,792 6,093 38,885
Consolidations and clean-up calls of off-balance sheet securitized
loans .............................................. (9,487) — (9,487)
Capitalized interest, premiums and discounts — off-balance sheet
securitized loans ..................................... 533 275 808
Total Managed student loan acquisitions...................... $23,838 $6,368 $30,206
As shown on the above table, off-balance sheet FFELP Stafford loans that consolidate with us become an
on-balance sheet interest earning asset. This activity results in impairments of our Retained Interests in
securitizations, but this is offset by an increase in on-balance sheet interest earning assets, for which we do not
record an offsetting gain.
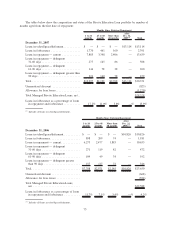
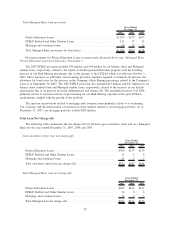
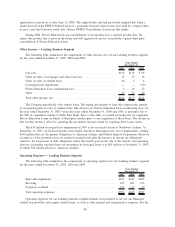
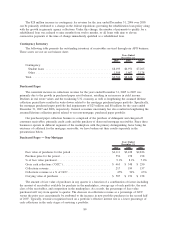
The following table includes on-balance sheet asset information for our Lending business segment.
2007 2006 2005
December 31,
FFELP Stafford and Other Student Loans, net ............... $ 35,726 $ 24,841 $19,988
FFELP Consolidation Loans, net ........................ 73,609 61,324 54,859
Managed Private Education Loans, net . ................... 14,818 9,755 7,757
Other loans, net ..................................... 1,174 1,309 1,138
Investments
(1)
...................................... 14,870 8,175 7,748
Residual Interest in off-balance sheet securitized loans ........ 3,044 3,341 2,406
Other
(2)
........................................... 8,953 4,859 3,576
Total assets ........................................ $152,194 $113,604 $97,472
(1)
Investments include cash and cash equivalents, short and long-term investments, restricted cash and investments, leveraged leases,
and municipal bonds.
(2)
Other assets include accrued interest receivable, goodwill and acquired intangible assets and other non-interest earning assets.
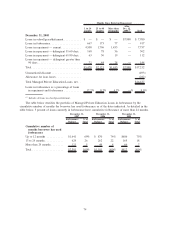
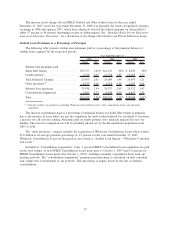
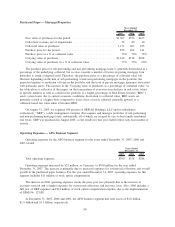
Preferred Channel Originations
In 2007, we originated $25.5 billion in student loan volume through our Preferred Channel, a 9 percent
increase over the $23.4 billion originated in 2006. In 2007, we grew the internal lending brand Preferred
Channel Originations by 27 percent and our own brands now constitute 65 percent of our Preferred Channel
Originations, up from 56 percent in 2006. At the same time, the JPMorgan Chase volume decreased by
41 percent and was 8 percent of our Preferred Channel Originations, down from 16 percent in 2005. The
pipeline of loans that we currently service and are committed to purchase was $5.4 billion and $5.4 billion at
81