Sallie Mae 2007 Annual Report Download - page 91
Download and view the complete annual report
Please find page 91 of the 2007 Sallie Mae annual report below. You can navigate through the pages in the report by either clicking on the pages listed below, or by using the keyword search tool below to find specific information within the annual report.-
 1
1 -
2
-
3
-
4
-
5
-
6
-
7
-
8
-
9
-
10
-
11
-
12
-
13
-
14
-
15
-
16
-
17
-
18
-
19
-
20
-
21
-
22
-
23
-
24
-
25
-
26
-
27
-
28
-
29
-
30
-
31
-
32
-
33
-
34
-
35
-
36
-
37
-
38
-
39
-
40
-
41
-
42
-
43
-
44
-
45
-
46
-
47
-
48
-
49
-
50
-
51
-
52
-
53
-
54
-
55
-
56
-
57
-
58
-
59
-
60
-
61
-
62
-
63
-
64
-
65
-
66
-
67
-
68
-
69
-
70
-
71
-
72
-
73
-
74
-
75
-
76
-
77
-
78
-
79
-
80
-
 81
81 -
 82
82 -
 83
83 -
 84
84 -
 85
85 -
 86
86 -
 87
87 -
 88
88 -
 89
89 -
 90
90 -
 91
91 -
 92
92 -
 93
93 -
 94
94 -
 95
95 -
 96
96 -
 97
97 -
 98
98 -
 99
99 -
 100
100 -
 101
101 -
102
-
103
-
104
-
105
-
106
-
107
-
108
-
109
-
110
-
111
-
112
-
113
-
114
-
115
-
116
-
117
-
118
-
119
-
120
-
121
-
122
-
123
-
124
-
125
-
126
-
127
-
128
-
129
-
130
-
131
-
132
-
133
-
134
-
135
-
136
-
137
-
138
-
139
-
140
-
141
-
142
-
143
-
144
-
145
-
146
-
147
-
148
-
149
-
150
-
151
-
152
-
153
-
154
-
155
-
156
-
157
-
158
-
159
-
160
-
161
-
162
-
163
-
164
-
165
-
166
-
167
-
168
-
169
-
170
-
171
-
172
-
173
-
174
-
175
-
176
-
177
-
178
-
179
-
180
-
181
-
182
-
183
-
184
-
185
-
186
-
187
-
188
-
189
-
190
-
191
-
192
-
193
-
194
-
195
-
196
-
197
-
198
-
199
-
200
-
201
-
202
-
203
-
204
-
205
-
206
-
207
-
208
-
209
-
210
-
211
-
212
-
213
-
214
-
215
-
216
-
217
-
218
-
219
 |
 |

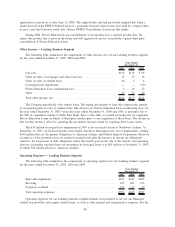
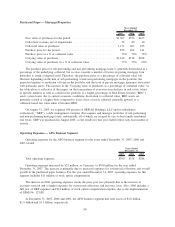
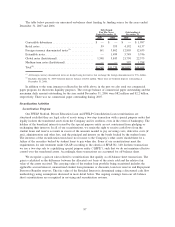
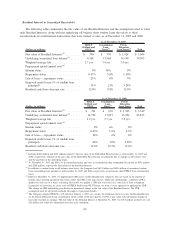
Purchased Paper — Mortgage/Properties
2007 2006 2005
Years Ended
December 31,
Face value of purchases for the period............................ $1,307 $556 $165
Collections revenue, net of impairments .......................... 52 40 10
Collateral value of purchases .................................. 1,171 607 195
Purchase price for the period .................................. 855 462 141
Purchase price as a % of collateral value .......................... 73% 76% 72%
Carrying value of purchases ................................... $1,162 $518 $298
Carrying value of purchases as a % of collateral value ................ 77% 75% 66%
The purchase price for sub-performing and non-performing mortgage loans is generally determined as a
percentage of the underlying collateral, but we also consider a number of factors in pricing mortgage loan
portfolios to attain a targeted yield. Therefore, the purchase price as a percentage of collateral value can
fluctuate depending on the mix of sub-performing versus non-performing mortgages in the portfolio, the
projected timeline to resolution of loans in the portfolio and the level of private mortgage insurance associated
with particular assets. The increase in the “Carrying value of purchases as a percentage of collateral value” in
the table above is reflective of the impact on the loan portion of year-over-year declines in real estate values
in specific markets as well as a shift in the portfolio to a higher percentage of Real Estate Owned (“REO”)
assets versus loans, due to current economic conditions. In relation to collateral value, REO assets are
generally carried at a higher basis compared to loans, since a loan is adjusted, generally upward, to a
collateral-based fair value when it becomes REO.
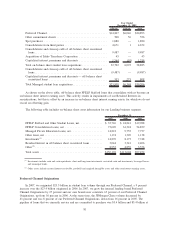
On August 31, 2005, we acquired 100 percent of GRP/AG Holdings, LLC and its subsidiaries
(collectively, “GRP”), a debt management company that acquires and manages portfolios of sub-performing
and non-performing mortgage loans, substantially all of which are secured by one-to-four family residential
real estate. GRP was purchased in August 2005, so the results for that year ended reflect only four months of
activity.
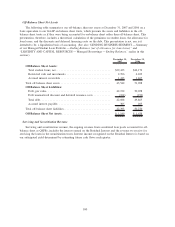
Operating Expenses — APG Business Segment
Operating expenses for the APG business segment for the years ended December 31, 2007, 2006 and
2005 totaled:
2007 2006 2005
Years Ended
December 31,
Total operating expenses ....................................... $390 $358 $288
Operating expenses increased by $32 million, or 9 percent, to $390 million for the year ended
December 31, 2007. The increase is primarily due to increased expenses for outsourced collections and overall
growth in the purchased paper business. For the year ended December 31, 2007, operating expenses for this
segment included $11 million of stock option compensation.
The increase in 2006 operating expenses versus the prior year was primarily due to the increase in
accounts serviced and to higher expenses for outsourced collections and recovery costs. Also, 2006 includes a
full year of GRP expenses and $12 million of stock option compensation expense, due to the implementation
of SFAS No. 123(R).
At December 31, 2007, 2006 and 2005, the APG business segment had total assets of $2.6 billion,
$1.5 billion and $1.1 billion, respectively.
90