Sallie Mae 2007 Annual Report Download - page 157
Download and view the complete annual report
Please find page 157 of the 2007 Sallie Mae annual report below. You can navigate through the pages in the report by either clicking on the pages listed below, or by using the keyword search tool below to find specific information within the annual report.-
 1
1 -
2
-
3
-
4
-
5
-
6
-
7
-
8
-
9
-
10
-
11
-
12
-
13
-
14
-
15
-
16
-
17
-
18
-
19
-
20
-
21
-
22
-
23
-
24
-
25
-
26
-
27
-
28
-
29
-
30
-
31
-
32
-
33
-
34
-
35
-
36
-
37
-
38
-
39
-
40
-
41
-
42
-
43
-
44
-
45
-
46
-
47
-
48
-
49
-
50
-
51
-
52
-
53
-
54
-
55
-
56
-
57
-
58
-
59
-
60
-
61
-
62
-
63
-
64
-
65
-
66
-
67
-
68
-
69
-
70
-
71
-
72
-
73
-
74
-
75
-
76
-
77
-
78
-
79
-
80
-
81
-
82
-
83
-
84
-
85
-
86
-
87
-
88
-
89
-
90
-
91
-
92
-
93
-
94
-
95
-
96
-
97
-
98
-
99
-
100
-
101
-
102
-
103
-
104
-
105
-
106
-
107
-
108
-
109
-
110
-
111
-
112
-
113
-
114
-
115
-
116
-
117
-
118
-
119
-
120
-
121
-
122
-
123
-
124
-
125
-
126
-
127
-
128
-
129
-
130
-
131
-
132
-
133
-
134
-
135
-
136
-
137
-
138
-
139
-
140
-
141
-
142
-
143
-
144
-
145
-
146
-
 147
147 -
 148
148 -
 149
149 -
 150
150 -
 151
151 -
 152
152 -
 153
153 -
 154
154 -
 155
155 -
 156
156 -
 157
157 -
 158
158 -
 159
159 -
 160
160 -
 161
161 -
 162
162 -
 163
163 -
 164
164 -
 165
165 -
 166
166 -
 167
167 -
168
-
169
-
170
-
171
-
172
-
173
-
174
-
175
-
176
-
177
-
178
-
179
-
180
-
181
-
182
-
183
-
184
-
185
-
186
-
187
-
188
-
189
-
190
-
191
-
192
-
193
-
194
-
195
-
196
-
197
-
198
-
199
-
200
-
201
-
202
-
203
-
204
-
205
-
206
-
207
-
208
-
209
-
210
-
211
-
212
-
213
-
214
-
215
-
216
-
217
-
218
-
219
 |
 |

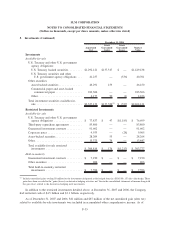
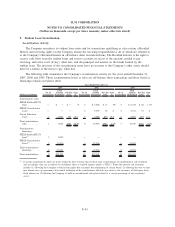
5. Investments (Continued)
December 31, 2007 and 2006, $196 million (none of which is in restricted cash and investments on the
balance sheet) and $418 million (of which $53 million is in restricted cash and investments on the balance
sheet), respectively, of available-for-sale investment securities were pledged as collateral.
The Company sold available-for-sale securities with a fair value of $73 million, $26 million, and
$625 million for the years ended December 31, 2007, 2006, and 2005, respectively. There were no realized
gains/(losses) for the year ended December 31, 2007 and $1 million realized loss and $1 million realized gain
for the years ended December 31, 2006, and 2005, respectively. The cost basis for these securities was
determined through specific identification of the securities sold.
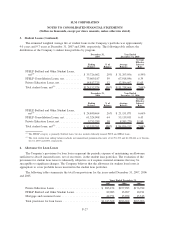
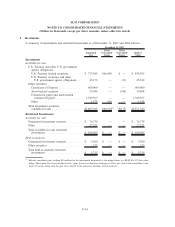
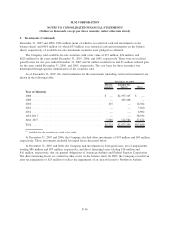
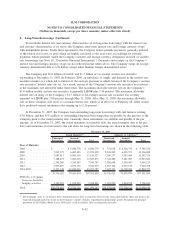
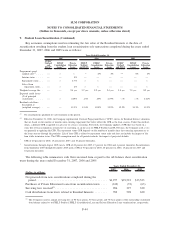
As of December 31, 2007, the stated maturities for the investments (including restricted investments) are
shown in the following table:
Held-to-
maturity
Available-for-
Sale(1) Other
December 31, 2007
Year of Maturity
2008 ............................................. $ — $2,397,165 $ —
2009 ............................................. — 465,648 —
2010 ............................................. 215 — 12,382
2011 ............................................. — — 7,400
2012 ............................................. — — 6,902
2013-2017 ........................................ — — 38,934
After 2017 ........................................ 5,500 112,582 27,422
Total ............................................. $5,715 $2,975,395 $93,040
(1)
Available-for-sale securities are stated at fair value.
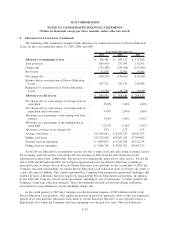
At December 31, 2007 and 2006, the Company also had other investments of $93 million and $99 million,
respectively. These investments included leveraged leases discussed below.
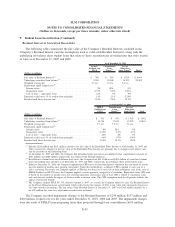
At December 31, 2007 and 2006, the Company had investments in leveraged leases, net of impairments,
totaling $86 million and $93 million, respectively, and direct financing leases totaling $14 million and
$16 million, respectively, that are general obligations of American Airlines and Federal Express Corporation.
The direct financing leases are carried in other assets on the balance sheet. In 2005, the Company recorded an
after-tax impairment of $25 million to reflect the impairment of an aircraft leased to Northwest Airlines.
F-36
SLM CORPORATION
NOTES TO CONSOLIDATED FINANCIAL STATEMENTS
(Dollars in thousands, except per share amounts, unless otherwise stated)