Sallie Mae 2007 Annual Report Download - page 89
Download and view the complete annual report
Please find page 89 of the 2007 Sallie Mae annual report below. You can navigate through the pages in the report by either clicking on the pages listed below, or by using the keyword search tool below to find specific information within the annual report.-
 1
1 -
2
-
3
-
4
-
5
-
6
-
7
-
8
-
9
-
10
-
11
-
12
-
13
-
14
-
15
-
16
-
17
-
18
-
19
-
20
-
21
-
22
-
23
-
24
-
25
-
26
-
27
-
28
-
29
-
30
-
31
-
32
-
33
-
34
-
35
-
36
-
37
-
38
-
39
-
40
-
41
-
42
-
43
-
44
-
45
-
46
-
47
-
48
-
49
-
50
-
51
-
52
-
53
-
54
-
55
-
56
-
57
-
58
-
59
-
60
-
61
-
62
-
63
-
64
-
65
-
66
-
67
-
68
-
69
-
70
-
71
-
72
-
73
-
74
-
75
-
76
-
77
-
78
-
 79
79 -
 80
80 -
 81
81 -
 82
82 -
 83
83 -
 84
84 -
 85
85 -
 86
86 -
 87
87 -
 88
88 -
 89
89 -
 90
90 -
 91
91 -
 92
92 -
 93
93 -
 94
94 -
 95
95 -
 96
96 -
 97
97 -
 98
98 -
 99
99 -
100
-
101
-
102
-
103
-
104
-
105
-
106
-
107
-
108
-
109
-
110
-
111
-
112
-
113
-
114
-
115
-
116
-
117
-
118
-
119
-
120
-
121
-
122
-
123
-
124
-
125
-
126
-
127
-
128
-
129
-
130
-
131
-
132
-
133
-
134
-
135
-
136
-
137
-
138
-
139
-
140
-
141
-
142
-
143
-
144
-
145
-
146
-
147
-
148
-
149
-
150
-
151
-
152
-
153
-
154
-
155
-
156
-
157
-
158
-
159
-
160
-
161
-
162
-
163
-
164
-
165
-
166
-
167
-
168
-
169
-
170
-
171
-
172
-
173
-
174
-
175
-
176
-
177
-
178
-
179
-
180
-
181
-
182
-
183
-
184
-
185
-
186
-
187
-
188
-
189
-
190
-
191
-
192
-
193
-
194
-
195
-
196
-
197
-
198
-
199
-
200
-
201
-
202
-
203
-
204
-
205
-
206
-
207
-
208
-
209
-
210
-
211
-
212
-
213
-
214
-
215
-
216
-
217
-
218
-
219
 |
 |

ASSET PERFORMANCE GROUP (“APG”) BUSINESS SEGMENT
In our APG business segment, we provide a wide range of accounts receivable and collections services
including student loan default aversion services, defaulted student loan portfolio management services,
contingency collections services for student loans and other asset classes, and accounts receivable management
and collection for purchased portfolios of receivables that are delinquent or have been charged off by their
original creditors as well as sub-performing and non-performing mortgage loans. In the purchased receivables
business, we focus on a variety of consumer debt types with emphasis on charged off credit card receivables
and distressed mortgage receivables. We purchase these portfolios at a discount to their face value, and then
use both our internal collection operations coupled with third-party collection agencies to maximize the
recovery on these receivables.
The private sector collections industry is highly fragmented with few large public companies and a large
number of small scale privately-held companies. The collections industry is highly competitive with credit card
collections being the most competitive in both contingency collections and purchased paper activities. We are
responding to these competitive challenges through enhanced servicing efficiencies and by continuing to build
on customer relationships through value added services and financings.
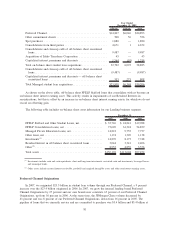
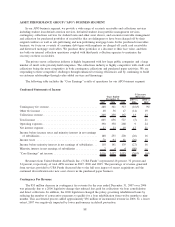
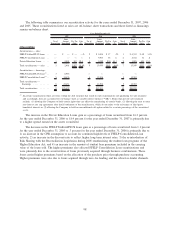
The following table includes the “Core Earnings” results of operations for our APG business segment.
Condensed Statements of Income
2007 2006 2005
2007 vs.
2006
2006 vs.
2005
Years Ended
December 31,
% Increase
(Decrease)
Contingency fee revenue ............................... 288 341 313 (16)% 9%
Other fee income .................................... 48 56 47 (14) 19
Collections revenue................................... 269 239 167 13 43
Total income ....................................... 605 636 527 (5) 21
Operating expenses ................................... 390 358 288 9 24
Net interest expense . . . ............................... 27 23 19 17 21
Income before income taxes and minority interest in net earnings
of subsidiaries ..................................... 188 255 220 (26) 16
Income taxes ....................................... 70 94 81 (26) 15
Income before minority interest in net earnings of subsidiaries . . . 118 161 139 (27) 16
Minority interest in net earnings of subsidiaries .............. 2 4 4 (50) —
“Core Earnings” net income ............................ $116 $157 $135 (26)% 16%
Revenues from United Student Aid Funds, Inc. (“USA Funds”) represented 28 percent, 32 percent and
34 percent, respectively, of total APG revenue in 2007, 2006 and 2005. The percentage of revenue generated
from services provided to USA Funds decreased due to the full year impact of recent acquisitions and the
continued diversification into new asset classes in the purchased paper business.
Contingency Fee Revenue
The $53 million decrease in contingency fee revenue for the year ended December 31, 2007 over 2006
was primarily due to a 2006 legislative change that reduced fees paid for collections via loan consolidation
and direct collections. In addition, the 2006 legislation changed the policy governing rehabilitated loans by
reducing the number of consecutive payments to qualify for a loan rehabilitation from twelve months to nine
months. This accelerated process added approximately $36 million of incremental revenue in 2006. To a lesser
extent, 2007 was negatively impacted by lower performance in default prevention.
88