Sallie Mae 2007 Annual Report Download - page 67
Download and view the complete annual report
Please find page 67 of the 2007 Sallie Mae annual report below. You can navigate through the pages in the report by either clicking on the pages listed below, or by using the keyword search tool below to find specific information within the annual report.-
 1
1 -
2
-
3
-
4
-
5
-
6
-
7
-
8
-
9
-
10
-
11
-
12
-
13
-
14
-
15
-
16
-
17
-
18
-
19
-
20
-
21
-
22
-
23
-
24
-
25
-
26
-
27
-
28
-
29
-
30
-
31
-
32
-
33
-
34
-
35
-
36
-
37
-
38
-
39
-
40
-
41
-
42
-
43
-
44
-
45
-
46
-
47
-
48
-
49
-
50
-
51
-
52
-
53
-
54
-
55
-
56
-
 57
57 -
 58
58 -
 59
59 -
 60
60 -
 61
61 -
 62
62 -
 63
63 -
 64
64 -
 65
65 -
 66
66 -
 67
67 -
 68
68 -
 69
69 -
 70
70 -
 71
71 -
 72
72 -
 73
73 -
 74
74 -
 75
75 -
 76
76 -
 77
77 -
78
-
79
-
80
-
81
-
82
-
83
-
84
-
85
-
86
-
87
-
88
-
89
-
90
-
91
-
92
-
93
-
94
-
95
-
96
-
97
-
98
-
99
-
100
-
101
-
102
-
103
-
104
-
105
-
106
-
107
-
108
-
109
-
110
-
111
-
112
-
113
-
114
-
115
-
116
-
117
-
118
-
119
-
120
-
121
-
122
-
123
-
124
-
125
-
126
-
127
-
128
-
129
-
130
-
131
-
132
-
133
-
134
-
135
-
136
-
137
-
138
-
139
-
140
-
141
-
142
-
143
-
144
-
145
-
146
-
147
-
148
-
149
-
150
-
151
-
152
-
153
-
154
-
155
-
156
-
157
-
158
-
159
-
160
-
161
-
162
-
163
-
164
-
165
-
166
-
167
-
168
-
169
-
170
-
171
-
172
-
173
-
174
-
175
-
176
-
177
-
178
-
179
-
180
-
181
-
182
-
183
-
184
-
185
-
186
-
187
-
188
-
189
-
190
-
191
-
192
-
193
-
194
-
195
-
196
-
197
-
198
-
199
-
200
-
201
-
202
-
203
-
204
-
205
-
206
-
207
-
208
-
209
-
210
-
211
-
212
-
213
-
214
-
215
-
216
-
217
-
218
-
219
 |
 |

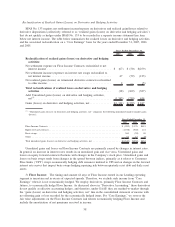
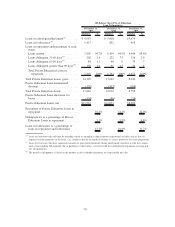
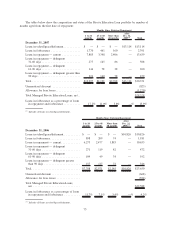
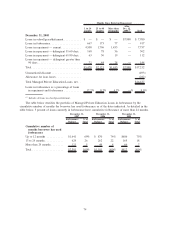
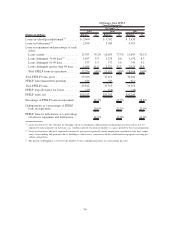
The following table summarizes changes in the allowance for Private Education Loan losses for the years
ended December 31, 2007, 2006 and 2005.
2007 2006 2005 2007 2006 2005 2007 2006 2005
Years Ended December 31, Years Ended December 31, Years Ended December 31,
On-Balance Sheet Off-Balance Sheet Managed Basis
Activity in Allowance for Private Education Loans
Allowance at beginning of
period . . . . . . . . . . . . . . . $ 308 $ 204 $ 172 $ 86 $ 78 $ 143 $ 394 $ 282 $ 315
Provision for Private
Education Loan losses . . . . 884 258 186 349 15 3 1,233 273 189
Change in net loss
estimates . . . . . . . . . . . . . — — (9) — — (76) — — (85)
Total provision . . . . . . . . . . 884 258 177 349 15 (73) 1,233 273 104
Charge-offs . . . . . . . . . . . . . (332) (160) (154) (107) (24) (2) (439) (184) (156)
Recoveries . . . . . . . . . . . . . 32 23 19 — — — 32 23 19
Net charge-offs . . . . . . . . . . (300) (137) (135) (107) (24) (2) (407) (161) (137)
Balance before securitization
of Private Education
Loans . . . . . . . . . . . . . . . 892 325 214 328 69 68 1,220 394 282
Reduction for securitization
of Private Education
Loans . . . . . . . . . . . . . . . (6) (17) (10) 6 17 10 — — —
Allowance at end of period . . $ 886 $ 308 $ 204 $ 334 $ 86 $ 78 $ 1,220 $ 394 $ 282
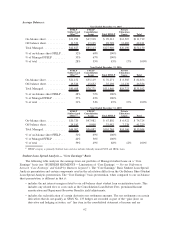
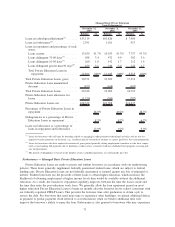
Net charge-offs as a
percentage of average loans
in repayment . . . . . . . . . . 5.04% 3.22% 4.14% 1.46% .43% .07% 3.07% 1.62% 1.89%
Net charge-offs as a
percentage of average loans
in repayment and
forbearance . . . . . . . . . . . 4.54% 2.99% 3.86% 1.27% .38% .06% 2.71% 1.47% 1.72%
Allowance as a percentage of
the ending total loan
balance . . . . . . . . . . . . . . 5.64% 3.06% 2.56% 2.41% .66% .89% 4.13% 1.71% 1.69%
Allowance as a percentage of
ending loans in
repayment . . . . . . . . . . . . 12.57% 6.36% 5.57% 4.28% 1.26% 1.68% 8.21% 3.38% 3.40%
Average coverage of net
charge-offs . . . . . . . . . . . 2.95 2.25 1.52 3.13 3.46 29.75 3.00 2.44 2.06
Average total loans. . . . . . . . $12,507 $ 8,585 $6,922 $13,683 $11,138 $7,238 $26,190 $19,723 $14,160
Ending total loans . . . . . . . . $15,704 $10,063 $7,961 $13,844 $12,919 $8,758 $29,548 $22,982 $16,719
Average loans in repayment . . $ 5,949 $ 4,257 $3,252 $ 7,305 $ 5,721 $4,002 $13,254 $ 9,978 $ 7,254
Ending loans in repayment . . $ 7,047 $ 4,851 $3,662 $ 7,819 $ 6,792 $4,653 $14,866 $11,643 $ 8,315
On-Balance Sheet versus Managed Presentation
All Private Education Loans are initially acquired on-balance sheet. When we securitize Private Education
Loans, we no longer legally own the loans and they are accounted for off-balance sheet. For our Managed
presentation in the table above, when loans are securitized, we reduce the on-balance sheet allowance for
amounts previously provided and then provide for these loans off-balance sheet with the total of both on and
off-balance sheet being the Managed allowance.
When Private Education Loans in our securitized trusts settling before September 30, 2005, become
180 days delinquent, we typically exercise our contingent call option to repurchase these loans at par value out
of the trust and record a loss for the difference in the par value paid and the fair market value of the loan at
the time of purchase. If these loans reach the 212-day delinquency, a charge-off for the remaining balance of
the loan is triggered. On a Managed Basis, the losses recorded under GAAP for loans repurchased at day 180
66