Sallie Mae 2007 Annual Report Download - page 11
Download and view the complete annual report
Please find page 11 of the 2007 Sallie Mae annual report below. You can navigate through the pages in the report by either clicking on the pages listed below, or by using the keyword search tool below to find specific information within the annual report.-
 1
1 -
 2
2 -
 3
3 -
 4
4 -
 5
5 -
 6
6 -
 7
7 -
 8
8 -
 9
9 -
 10
10 -
 11
11 -
 12
12 -
 13
13 -
 14
14 -
 15
15 -
 16
16 -
 17
17 -
 18
18 -
 19
19 -
 20
20 -
 21
21 -
 22
22 -
23
-
24
-
25
-
26
-
27
-
28
-
29
-
30
-
31
-
32
-
33
-
34
-
35
-
36
-
37
-
38
-
39
-
40
-
41
-
42
-
43
-
44
-
45
-
46
-
47
-
48
-
49
-
50
-
51
-
52
-
53
-
54
-
55
-
56
-
57
-
58
-
59
-
60
-
61
-
62
-
63
-
64
-
65
-
66
-
67
-
68
-
69
-
70
-
71
-
72
-
73
-
74
-
75
-
76
-
77
-
78
-
79
-
80
-
81
-
82
-
83
-
84
-
85
-
86
-
87
-
88
-
89
-
90
-
91
-
92
-
93
-
94
-
95
-
96
-
97
-
98
-
99
-
100
-
101
-
102
-
103
-
104
-
105
-
106
-
107
-
108
-
109
-
110
-
111
-
112
-
113
-
114
-
115
-
116
-
117
-
118
-
119
-
120
-
121
-
122
-
123
-
124
-
125
-
126
-
127
-
128
-
129
-
130
-
131
-
132
-
133
-
134
-
135
-
136
-
137
-
138
-
139
-
140
-
141
-
142
-
143
-
144
-
145
-
146
-
147
-
148
-
149
-
150
-
151
-
152
-
153
-
154
-
155
-
156
-
157
-
158
-
159
-
160
-
161
-
162
-
163
-
164
-
165
-
166
-
167
-
168
-
169
-
170
-
171
-
172
-
173
-
174
-
175
-
176
-
177
-
178
-
179
-
180
-
181
-
182
-
183
-
184
-
185
-
186
-
187
-
188
-
189
-
190
-
191
-
192
-
193
-
194
-
195
-
196
-
197
-
198
-
199
-
200
-
201
-
202
-
203
-
204
-
205
-
206
-
207
-
208
-
209
-
210
-
211
-
212
-
213
-
214
-
215
-
216
-
217
-
218
-
219
 |
 |
operational and performance indicators that are most closely assessed by management. Management believes
this information provides additional insight into the financial performance of the core business activities of our
operating segments. (See “MANAGEMENT’S DISCUSSION AND ANALYSIS OF FINANCIAL CONDI-
TION AND RESULTS OF OPERATIONS — BUSINESS SEGMENTS” for a detailed discussion of our “Core
Earnings,” including a table that summarizes the pre-tax differences between “Core Earnings” and GAAP by
business segment and the limitations to this presentation. )
We generate most of our “Core Earnings” earnings in our Lending business from the spread between the
yield we receive on our Managed portfolio of student loans and the cost of funding these loans less the
provisions for loan losses. We incur servicing, selling and administrative expenses in providing these products
and services, and provide for loan losses. On our consolidated statement of income, prepared in accordance
with GAAP, this spread income is reported as “net interest income” for on-balance sheet loans, and as “gains
on student loan securitizations” and “servicing and securitization revenue” for off-balance sheet loans for
which we have a Retained Interest. Total “Core Earnings” revenues for this segment were $1.4 billion in 2007.
In our APG business segment, we provide a wide range of accounts receivable and collections services
including student loan default aversion services, defaulted student loan portfolio management services,
contingency collections services for student loans and other asset classes, and accounts receivable management
and collection for purchased portfolios of receivables that are delinquent or have been charged off by their
original creditors as well as sub-performing and non-performing mortgage loans. In the purchased receivables
business, we focus on a variety of consumer debt types with emphasis on charged-off credit card receivables
and distressed mortgage receivables. We purchase these portfolios at a discount to their face value, and then
use both our internal collection operations coupled with third-party collection agencies to maximize the
recovery on these receivables.
LENDING BUSINESS SEGMENT
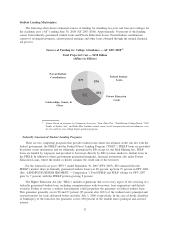
In our Lending business segment, we originate and acquire both federally guaranteed student loans
(FFELP loans), which are administered by the U.S. Department of Education (“ED”), and Private Education
Loans, which are not federally guaranteed. Borrowers use Private Education Loans primarily to supplement
federally guaranteed loans in meeting the cost of education. We manage the largest portfolio of FFELP and
Private Education Loans in the student loan industry, serving over 10 million student and parent customers
through our ownership and management of $163.6 billion in Managed student loans as of December 31, 2007,
of which $135.2 billion or 83 percent are federally insured. We serve a diverse range of clients that includes
over 6,000 educational and financial institutions and state agencies. We are the largest servicer of student
loans, servicing a portfolio of $127.4 billion of FFELP loans and $32.6 billion of Private Education Loans as
of December 31, 2007. We also market student loans, both federal and private, directly to the consumer. In
addition to education lending, we originate mortgage and consumer loans. In 2007 we originated $848 million
in mortgage and consumer loans. Our mortgage and consumer loan portfolio totaled $545 million at
December 31, 2007, of which $19 million are mortgages in the held-for-sale portfolio.
10