Sallie Mae 2007 Annual Report Download - page 49
Download and view the complete annual report
Please find page 49 of the 2007 Sallie Mae annual report below. You can navigate through the pages in the report by either clicking on the pages listed below, or by using the keyword search tool below to find specific information within the annual report.-
 1
1 -
2
-
3
-
4
-
5
-
6
-
7
-
8
-
9
-
10
-
11
-
12
-
13
-
14
-
15
-
16
-
17
-
18
-
19
-
20
-
21
-
22
-
23
-
24
-
25
-
26
-
27
-
28
-
29
-
30
-
31
-
32
-
33
-
34
-
35
-
36
-
37
-
38
-
 39
39 -
 40
40 -
 41
41 -
 42
42 -
 43
43 -
 44
44 -
 45
45 -
 46
46 -
 47
47 -
 48
48 -
 49
49 -
 50
50 -
 51
51 -
 52
52 -
 53
53 -
 54
54 -
 55
55 -
 56
56 -
 57
57 -
 58
58 -
 59
59 -
60
-
61
-
62
-
63
-
64
-
65
-
66
-
67
-
68
-
69
-
70
-
71
-
72
-
73
-
74
-
75
-
76
-
77
-
78
-
79
-
80
-
81
-
82
-
83
-
84
-
85
-
86
-
87
-
88
-
89
-
90
-
91
-
92
-
93
-
94
-
95
-
96
-
97
-
98
-
99
-
100
-
101
-
102
-
103
-
104
-
105
-
106
-
107
-
108
-
109
-
110
-
111
-
112
-
113
-
114
-
115
-
116
-
117
-
118
-
119
-
120
-
121
-
122
-
123
-
124
-
125
-
126
-
127
-
128
-
129
-
130
-
131
-
132
-
133
-
134
-
135
-
136
-
137
-
138
-
139
-
140
-
141
-
142
-
143
-
144
-
145
-
146
-
147
-
148
-
149
-
150
-
151
-
152
-
153
-
154
-
155
-
156
-
157
-
158
-
159
-
160
-
161
-
162
-
163
-
164
-
165
-
166
-
167
-
168
-
169
-
170
-
171
-
172
-
173
-
174
-
175
-
176
-
177
-
178
-
179
-
180
-
181
-
182
-
183
-
184
-
185
-
186
-
187
-
188
-
189
-
190
-
191
-
192
-
193
-
194
-
195
-
196
-
197
-
198
-
199
-
200
-
201
-
202
-
203
-
204
-
205
-
206
-
207
-
208
-
209
-
210
-
211
-
212
-
213
-
214
-
215
-
216
-
217
-
218
-
219
 |
 |
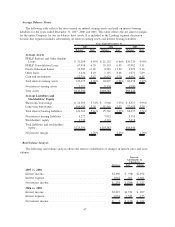
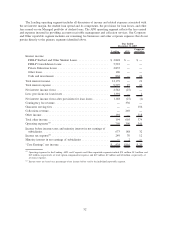
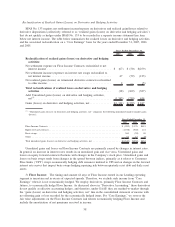
The changes in net interest income are primarily due to fluctuations in the student loan spread discussed
below, as well as the growth of our student loan portfolio and the level of cash and investments we may hold
on our balance sheet for liquidity purposes. In connection with the Merger Agreement, we increased our
liquidity portfolio to higher than historical levels. The liquidity portfolio has a negative net interest margin
and, as a result, the increase in this portfolio reduced net interest income by $18 million for the year ended
December 31, 2007.
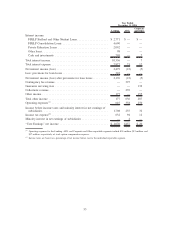
Student Loans
For both federally insured and Private Education Loans, we account for premiums paid, discounts
received and certain origination costs incurred on the origination and acquisition of student loans in
accordance with SFAS No. 91, “Accounting for Nonrefundable Fees and Costs Associated with Originating or
Acquiring Loans and Initial Direct Costs of Leases.” The unamortized portion of the premiums and discounts
is included in the carrying value of the student loan on the consolidated balance sheet. We recognize income
on our student loan portfolio based on the expected yield of the student loan after giving effect to the
amortization of purchase premiums and the accretion of student loan discounts, as well as interest rate
reductions and rebates expected to be earned through Repayment Borrower Benefits programs. Discounts on
Private Education Loans are deferred and accreted to income over the lives of the student loans. In the table
below, this accretion of discounts is netted with the amortization of the premiums.
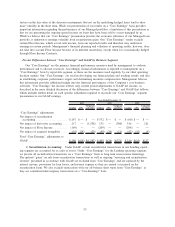
Student Loan Spread
An important performance measure closely monitored by management is the student loan spread. The
student loan spread is the difference between the income earned on the student loan assets and the interest
paid on the debt funding those assets. A number of factors can affect the overall student loan spread, such as:
• the mix of student loans in the portfolio, with FFELP Consolidation Loans having the lowest spread
and Private Education Loans having the highest spread;
• the premiums paid, borrower fees charged and capitalized costs incurred to acquire student loans, which
impact the spread through subsequent amortization;
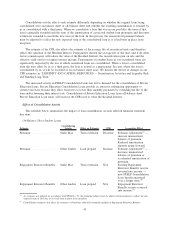
• the type and level of Repayment Borrower Benefits programs for which the student loans are eligible;
• the level of Floor Income and, when considering the “Core Earnings” spread, the amount of Floor
Income-eligible loans that have been hedged through Floor Income Contracts; and
• funding and hedging costs.
48