Sallie Mae 2007 Annual Report Download - page 35
Download and view the complete annual report
Please find page 35 of the 2007 Sallie Mae annual report below. You can navigate through the pages in the report by either clicking on the pages listed below, or by using the keyword search tool below to find specific information within the annual report.-
 1
1 -
2
-
3
-
4
-
5
-
6
-
7
-
8
-
9
-
10
-
11
-
12
-
13
-
14
-
15
-
16
-
17
-
18
-
19
-
20
-
21
-
22
-
23
-
24
-
 25
25 -
 26
26 -
 27
27 -
 28
28 -
 29
29 -
 30
30 -
 31
31 -
 32
32 -
 33
33 -
 34
34 -
 35
35 -
 36
36 -
 37
37 -
 38
38 -
 39
39 -
 40
40 -
 41
41 -
 42
42 -
 43
43 -
 44
44 -
 45
45 -
46
-
47
-
48
-
49
-
50
-
51
-
52
-
53
-
54
-
55
-
56
-
57
-
58
-
59
-
60
-
61
-
62
-
63
-
64
-
65
-
66
-
67
-
68
-
69
-
70
-
71
-
72
-
73
-
74
-
75
-
76
-
77
-
78
-
79
-
80
-
81
-
82
-
83
-
84
-
85
-
86
-
87
-
88
-
89
-
90
-
91
-
92
-
93
-
94
-
95
-
96
-
97
-
98
-
99
-
100
-
101
-
102
-
103
-
104
-
105
-
106
-
107
-
108
-
109
-
110
-
111
-
112
-
113
-
114
-
115
-
116
-
117
-
118
-
119
-
120
-
121
-
122
-
123
-
124
-
125
-
126
-
127
-
128
-
129
-
130
-
131
-
132
-
133
-
134
-
135
-
136
-
137
-
138
-
139
-
140
-
141
-
142
-
143
-
144
-
145
-
146
-
147
-
148
-
149
-
150
-
151
-
152
-
153
-
154
-
155
-
156
-
157
-
158
-
159
-
160
-
161
-
162
-
163
-
164
-
165
-
166
-
167
-
168
-
169
-
170
-
171
-
172
-
173
-
174
-
175
-
176
-
177
-
178
-
179
-
180
-
181
-
182
-
183
-
184
-
185
-
186
-
187
-
188
-
189
-
190
-
191
-
192
-
193
-
194
-
195
-
196
-
197
-
198
-
199
-
200
-
201
-
202
-
203
-
204
-
205
-
206
-
207
-
208
-
209
-
210
-
211
-
212
-
213
-
214
-
215
-
216
-
217
-
218
-
219
 |
 |

PART II.
Item 5. Market for Registrant’s Common Equity, Related Stockholder Matters and Issuer Purchases of
Equity Securities
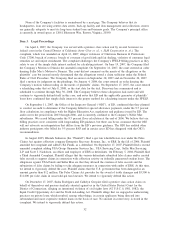
The Company’s common stock is listed and traded on the New York Stock Exchange under the symbol
SLM. The number of holders of record of the Company’s common stock as of January 31, 2008 was 714. The
following table sets forth the high and low sales prices for the Company’s common stock for each full
quarterly period within the two most recent fiscal years.
Common Stock Prices
1st Quarter 2nd Quarter 3rd Quarter 4th Quarter
2007 ......................... High $49.96 $57.96 $58.00 $53.65
Low 40.30 40.60 41.73 18.68
2006 ......................... High $58.35 $55.21 $53.07 $52.09
Low 51.86 50.05 45.76 44.65
The Company paid quarterly cash dividends of $.22 for the first quarter of 2006, $.25 for the last three
quarters of 2006 and $.25 for the first quarter of 2007.
Issuer Purchases of Equity Securities
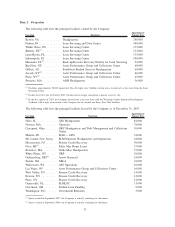
The following table summarizes the Company’s common share repurchases during 2007 pursuant to the
stock repurchase program (see Note 12 to the consolidated financial statements, “Stockholders’ Equity”) first
authorized in September 1997 by the Board of Directors. Since the inception of the program, which has no
expiration date, the Board of Directors has authorized the purchase of up to 342.5 million shares as of
December 31, 2007. Included in this total are 25 million additional shares authorized for repurchase by the
Board in November 2007.
Total Number
of Shares
Purchased
(1)
Average Price
Paid per
Share
Total Number of
Shares Purchased
as Part of Publicly
Announced Plans
or Programs
Maximum Number
of Shares that
May Yet Be
Purchased Under
the Plans or
Programs
(2)
(Common shares in millions)
Period:
January 1 – March 31, 2007 . . . .2 $45.87 — 15.7
April 1 – June 30, 2007....... .8 41.18 — 15.7
July 1 – September 30, 2007 . . . 2.1 48.47 — 15.7
October 1 – October 31, 2007 . . .1 48.10 — 15.7
November 1 – November 30,
2007 ................... 1.1 39.75 1.0 39.6
December 1 – December 31,
2007
(3)
................. 49.0 44.57 49.0 38.8
Total fourth quarter .......... 50.2 44.48 50.0
Year ended December 31,
2007 ................... 53.3 $44.59 50.0
(1)
The total number of shares purchased includes: i) shares purchased under the stock repurchase program discussed above, and
ii) shares purchased in connection with the exercise of stock options and vesting of performance stock to satisfy minimum statu-
tory tax withholding obligations and shares tendered by employees to satisfy option exercise costs (which combined totaled
3.3 million shares for 2007).
(2)
Reduced by outstanding equity forward contracts.
(3)
Includes 44 million shares under an equity forward contract that the Company agreed to physically settle with Citibank, N.A., on
December 31, 2007.
34