Sallie Mae 2007 Annual Report Download - page 93
Download and view the complete annual report
Please find page 93 of the 2007 Sallie Mae annual report below. You can navigate through the pages in the report by either clicking on the pages listed below, or by using the keyword search tool below to find specific information within the annual report.-
 1
1 -
2
-
3
-
4
-
5
-
6
-
7
-
8
-
9
-
10
-
11
-
12
-
13
-
14
-
15
-
16
-
17
-
18
-
19
-
20
-
21
-
22
-
23
-
24
-
25
-
26
-
27
-
28
-
29
-
30
-
31
-
32
-
33
-
34
-
35
-
36
-
37
-
38
-
39
-
40
-
41
-
42
-
43
-
44
-
45
-
46
-
47
-
48
-
49
-
50
-
51
-
52
-
53
-
54
-
55
-
56
-
57
-
58
-
59
-
60
-
61
-
62
-
63
-
64
-
65
-
66
-
67
-
68
-
69
-
70
-
71
-
72
-
73
-
74
-
75
-
76
-
77
-
78
-
79
-
80
-
81
-
82
-
 83
83 -
 84
84 -
 85
85 -
 86
86 -
 87
87 -
 88
88 -
 89
89 -
 90
90 -
 91
91 -
 92
92 -
 93
93 -
 94
94 -
 95
95 -
 96
96 -
 97
97 -
 98
98 -
 99
99 -
 100
100 -
 101
101 -
 102
102 -
 103
103 -
104
-
105
-
106
-
107
-
108
-
109
-
110
-
111
-
112
-
113
-
114
-
115
-
116
-
117
-
118
-
119
-
120
-
121
-
122
-
123
-
124
-
125
-
126
-
127
-
128
-
129
-
130
-
131
-
132
-
133
-
134
-
135
-
136
-
137
-
138
-
139
-
140
-
141
-
142
-
143
-
144
-
145
-
146
-
147
-
148
-
149
-
150
-
151
-
152
-
153
-
154
-
155
-
156
-
157
-
158
-
159
-
160
-
161
-
162
-
163
-
164
-
165
-
166
-
167
-
168
-
169
-
170
-
171
-
172
-
173
-
174
-
175
-
176
-
177
-
178
-
179
-
180
-
181
-
182
-
183
-
184
-
185
-
186
-
187
-
188
-
189
-
190
-
191
-
192
-
193
-
194
-
195
-
196
-
197
-
198
-
199
-
200
-
201
-
202
-
203
-
204
-
205
-
206
-
207
-
208
-
209
-
210
-
211
-
212
-
213
-
214
-
215
-
216
-
217
-
218
-
219
 |
 |

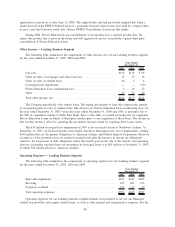
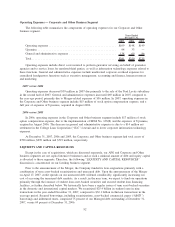
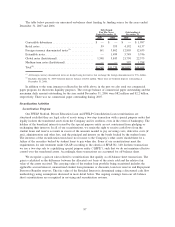
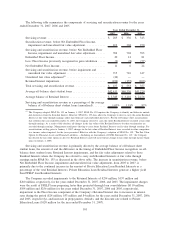
Operating Expenses — Corporate and Other Business Segment
The following table summarizes the components of operating expenses for our Corporate and Other
business segment.
2007 2006 2005
Years Ended
December 31,
Operating expenses ........................................... $109 $148 $149
Upromise .................................................. 94 33 —
General and administrative expenses .............................. 138 69 86
Total ...................................................... $341 $250 $235
Operating expenses include direct costs incurred to perform guarantor servicing on behalf of guarantor
agencies and to service loans for unrelated third parties, as well as information technology expenses related to
these functions. General and administrative expenses include unallocated corporate overhead expenses for
centralized headquarters functions such as executive management, accounting and finance, human resources
and marketing.
2007 versus 2006
Operating expenses decreased $39 million in 2007 due primarily to the sale of the Noel Levitz subsidiary
in the second half of 2007. General and administrative expenses increased $69 million in 2007 compared to
the year-ago period, primarily due to Merger-related expenses of $56 million. In 2007, operating expenses in
the Corporate and Other business segment include $15 million of stock option compensation expense, and a
full year of expenses of Upromise, acquired in August 2006.
2006 versus 2005
In 2006, operating expenses in the Corporate and Other business segment include $17 million of stock
option compensation expense, due to the implementation of SFAS No. 123(R) and the expenses of Upromise,
acquired in August 2006. The decrease in general and administrative expenses is due to a $14 million net
settlement in the College Loan Corporation (“CLC”) lawsuit and to lower corporate information technology
expenses.
At December 31, 2007, 2006 and 2005, the Corporate and Other business segment had total assets of
$780 million, $999 million and $719 million, respectively.
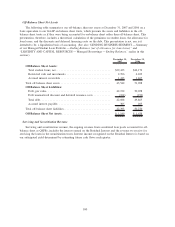
LIQUIDITY AND CAPITAL RESOURCES
Except in the case of acquisitions, which are discussed separately, our APG and Corporate and Other
business segments are not capital intensive businesses and as such a minimal amount of debt and equity capital
is allocated to these segments. Therefore, the following “LIQUIDITY AND CAPITAL RESOURCES”
discussion is concentrated on our Lending business segment.
Prior to the announcement of the Merger, the Company funded its loan originations primarily with a
combination of term asset-backed securitizations and unsecured debt. Upon the announcement of the Merger
on April 17, 2007, credit spreads on our unsecured debt widened considerably, significantly increasing our
cost of accessing the unsecured debt markets. As a result, in the near term, we expect to fund our operations
primarily through the issuance of student loan asset-backed securities and secured student loan financing
facilities, as further described below. We historically have been a regular issuer of term asset-backed securities
in the domestic and international capital markets. We securitized $25.4 billion in student loans in nine
transactions in the year ended December 31, 2007, compared to $32.1 billion in thirteen transactions in the
year-ago period. Secured borrowings, including securitizations, asset-backed commercial paper (“ABCP”)
borrowings and indentured trusts, comprised 75 percent of our Managed debt outstanding at December 31,
2007, versus 69 percent at December 31, 2006.
92