Sallie Mae 2007 Annual Report Download - page 168
Download and view the complete annual report
Please find page 168 of the 2007 Sallie Mae annual report below. You can navigate through the pages in the report by either clicking on the pages listed below, or by using the keyword search tool below to find specific information within the annual report.-
 1
1 -
2
-
3
-
4
-
5
-
6
-
7
-
8
-
9
-
10
-
11
-
12
-
13
-
14
-
15
-
16
-
17
-
18
-
19
-
20
-
21
-
22
-
23
-
24
-
25
-
26
-
27
-
28
-
29
-
30
-
31
-
32
-
33
-
34
-
35
-
36
-
37
-
38
-
39
-
40
-
41
-
42
-
43
-
44
-
45
-
46
-
47
-
48
-
49
-
50
-
51
-
52
-
53
-
54
-
55
-
56
-
57
-
58
-
59
-
60
-
61
-
62
-
63
-
64
-
65
-
66
-
67
-
68
-
69
-
70
-
71
-
72
-
73
-
74
-
75
-
76
-
77
-
78
-
79
-
80
-
81
-
82
-
83
-
84
-
85
-
86
-
87
-
88
-
89
-
90
-
91
-
92
-
93
-
94
-
95
-
96
-
97
-
98
-
99
-
100
-
101
-
102
-
103
-
104
-
105
-
106
-
107
-
108
-
109
-
110
-
111
-
112
-
113
-
114
-
115
-
116
-
117
-
118
-
119
-
120
-
121
-
122
-
123
-
124
-
125
-
126
-
127
-
128
-
129
-
130
-
131
-
132
-
133
-
134
-
135
-
136
-
137
-
138
-
139
-
140
-
141
-
142
-
143
-
144
-
145
-
146
-
147
-
148
-
149
-
150
-
151
-
152
-
153
-
154
-
155
-
156
-
157
-
 158
158 -
 159
159 -
 160
160 -
 161
161 -
 162
162 -
 163
163 -
 164
164 -
 165
165 -
 166
166 -
 167
167 -
 168
168 -
 169
169 -
 170
170 -
 171
171 -
 172
172 -
 173
173 -
 174
174 -
 175
175 -
 176
176 -
 177
177 -
 178
178 -
179
-
180
-
181
-
182
-
183
-
184
-
185
-
186
-
187
-
188
-
189
-
190
-
191
-
192
-
193
-
194
-
195
-
196
-
197
-
198
-
199
-
200
-
201
-
202
-
203
-
204
-
205
-
206
-
207
-
208
-
209
-
210
-
211
-
212
-
213
-
214
-
215
-
216
-
217
-
218
-
219
 |
 |

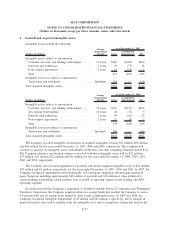
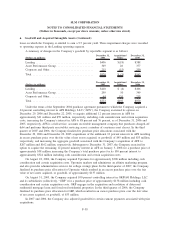
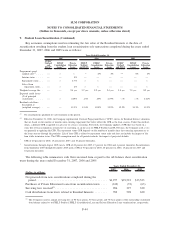
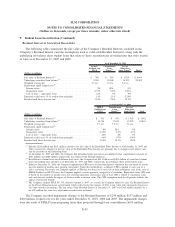
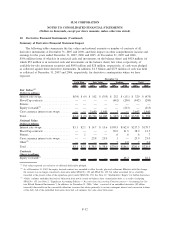
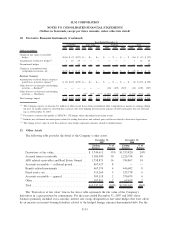
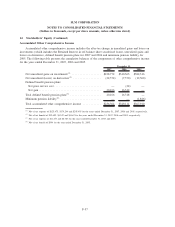
9. Student Loan Securitization (Continued)
The following table reflects the sensitivity of the current fair value of the Retained Interests to adverse
changes in the key economic assumptions used in the valuation of the Retained Interest at December 31, 2007,
discussed in detail in the preceding table. The effect of a variation in a particular assumption on the fair value
of the Retained Interest is calculated without changing any other assumption. In reality, changes in one factor
may result in changes in another (for example, increases in market interest rates may result in lower
prepayments and increased credit losses), which might magnify or counteract the sensitivities. These
sensitivities are hypothetical, as the actual results could be materially different than these estimates.
(Dollars in millions)
FFELP
Stafford/PLUS
Loan Trusts
FFELP
Consolidation
Loan Trusts
Private Education
Loan Trusts
Year Ended December 31, 2007
Fair value of Residual Interest
(1)
............................... $390 $730
(2)
$1,924
Weighted-average life . ..................................... 2.7yrs. 7.4 yrs. 7.0 yrs.
Prepayment speed assumptions
(3)
..............................
Interim status ......................................... 0% N/A 0%
Repayment status ....................................... 0-37% 3-8% 1-30%
Life of loan — repayment status ............................. 21% 6% 9%
Impact on fair value of 5% absolute increase ...................... $ (33) $(115) $ (393)
Impact on fair value of 10% absolute increase ..................... $ (58) $(196) $ (684)
Expected credit losses (as a% of student loan principal) .............. .11% .21% 5.28%
(4)
Impact on fair value of 5% absolute increase in default rate ............ $ (6) $ (15) $ (344)
Impact on fair value of 10% absolute increase in default rate ........... $ (16) $ (28) $ (688)
Residual cash flows discount rate ............................. 12.0% 9.8% 12.9%
Impact on fair value of 5% absolute increase ...................... $ (29) $(127) $ (368)
Impact on fair value of 10% absolute increase ..................... $ (54) $(220) $ (629)
Difference between Asset and Funding underlying indices
(5)(6)
3 month LIBOR forward curve at December 31, 2007
plus contracted spreads
Impact on fair value of 0.25% absolute increase in funding index compared
to asset index . . . ..................................... $ (60) $(187) $ (6)
Impact on fair value of 0.50% absolute increase in funding index compared
to asset index . . . ..................................... $(120) $(373) $ (13)
(1)
In addition to the assumptions in the table above, the Company also projects the reduction in distributions that will result from the various benefit pro-
grams that exist related to consecutive on-time payments by borrowers. Related to the entire $3.0 billion Residual Interest there is $227 million (present
value) of benefits projected which reduce the fair value.
(2)
Certain consolidation trusts have $3.4 billion of non-U.S. dollar (Euro denominated) bonds outstanding. To convert these non-U.S. dollar denominated
bonds into U.S. dollar liabilities, the trusts have entered into foreign-currency swaps with highly-rated counterparties. These swaps are in a $963 million
gain position (in the aggregate) and $315 million position net of collateral posted as a result of the decline in the exchange rates between the U.S. dollar
and the Euro. This unrealized market value gain is not part of the fair value of the Residual Interest in the table above. Not all derivatives within the trusts
require the swap counterparties to post collateral to the respective trust for changes in market value, unless the trust’s swap counterparty’s credit rating
has been withdrawn or has been downgraded below a certain level. If the swap counterparty does not post the required collateral or is downgraded further,
the counterparty must find a suitable replacement counterparty or provide the trust with a letter of credit or a guaranty from an entity that has the required
credit ratings. Ultimately, the Company’s exposure related to a swap counterparty failing to make its payments is limited to the fair value of the related
trust’s Residual Interest which was $404 million as of December 31, 2007.
(3)
See previous table for details on CPR. Impact on fair value due to increase in prepayment speeds only increases the repayment status speeds. Interim sta-
tus CPR remains 0%.
(4)
Expected credit losses are used to project future cash flows related to the Private Education Loan securitization’s Residual Interest. However, for all trusts
settling prior to September 30, 2005, the Company, to date, has purchased loans at par when the loans reach 180 days delinquent prior to default under a
contingent call option, resulting in no credit losses at the trust nor related to the Company’s Residual Interest. When the Company exercises its contingent
call option and purchases the loan from the trust at par, the Company records a loss related to these loans that are now on the Company’s balance sheet.
The Company recorded losses of $123 million, $48 million, and $32 million for the years ended December 31, 2007, 2006 and 2005, respectively, related
to this activity and speciality claims. For all trusts settling after October 1, 2005 the Company does not hold this contingent call option. Credit losses, net
of recoveries, for these trusts where the Company does not hold the contingent call option, were $21.5 million and $2.1 million for the years ended
December 31, 2007 and 2006, respectively.
(5)
Student loan assets are primarily indexed to a Treasury bill, commercial paper or a prime index. Funding within the trust is primarily indexed to a LIBOR
index. Sensitivity analysis increases funding indexes as indicated while keeping asset underlying indexes fixed.
(6)
At December 31, 2007, the Company had $2.3 billion of auction rate securities outstanding in its off-balance sheet trusts. In February 2008, an imbalance
of supply and demand in the auction rate securities market as a whole led to failures of the auctions pursuant to which certain of the Company’s auction
rate securities’ interest rates are set. As a result, certain of the Company’s auction rate securities currently bear interest at the maximum rate allowable
under their terms. The maximum allowable interest rate on these auction rate securities is generally LIBOR plus 1.50 percent, with limited exceptions.
F-47
SLM CORPORATION
NOTES TO CONSOLIDATED FINANCIAL STATEMENTS
(Dollars in thousands, except per share amounts, unless otherwise stated)