Sallie Mae 2007 Annual Report Download - page 96
Download and view the complete annual report
Please find page 96 of the 2007 Sallie Mae annual report below. You can navigate through the pages in the report by either clicking on the pages listed below, or by using the keyword search tool below to find specific information within the annual report.-
 1
1 -
2
-
3
-
4
-
5
-
6
-
7
-
8
-
9
-
10
-
11
-
12
-
13
-
14
-
15
-
16
-
17
-
18
-
19
-
20
-
21
-
22
-
23
-
24
-
25
-
26
-
27
-
28
-
29
-
30
-
31
-
32
-
33
-
34
-
35
-
36
-
37
-
38
-
39
-
40
-
41
-
42
-
43
-
44
-
45
-
46
-
47
-
48
-
49
-
50
-
51
-
52
-
53
-
54
-
55
-
56
-
57
-
58
-
59
-
60
-
61
-
62
-
63
-
64
-
65
-
66
-
67
-
68
-
69
-
70
-
71
-
72
-
73
-
74
-
75
-
76
-
77
-
78
-
79
-
80
-
81
-
82
-
83
-
84
-
85
-
 86
86 -
 87
87 -
 88
88 -
 89
89 -
 90
90 -
 91
91 -
 92
92 -
 93
93 -
 94
94 -
 95
95 -
 96
96 -
 97
97 -
 98
98 -
 99
99 -
 100
100 -
 101
101 -
 102
102 -
 103
103 -
 104
104 -
 105
105 -
 106
106 -
107
-
108
-
109
-
110
-
111
-
112
-
113
-
114
-
115
-
116
-
117
-
118
-
119
-
120
-
121
-
122
-
123
-
124
-
125
-
126
-
127
-
128
-
129
-
130
-
131
-
132
-
133
-
134
-
135
-
136
-
137
-
138
-
139
-
140
-
141
-
142
-
143
-
144
-
145
-
146
-
147
-
148
-
149
-
150
-
151
-
152
-
153
-
154
-
155
-
156
-
157
-
158
-
159
-
160
-
161
-
162
-
163
-
164
-
165
-
166
-
167
-
168
-
169
-
170
-
171
-
172
-
173
-
174
-
175
-
176
-
177
-
178
-
179
-
180
-
181
-
182
-
183
-
184
-
185
-
186
-
187
-
188
-
189
-
190
-
191
-
192
-
193
-
194
-
195
-
196
-
197
-
198
-
199
-
200
-
201
-
202
-
203
-
204
-
205
-
206
-
207
-
208
-
209
-
210
-
211
-
212
-
213
-
214
-
215
-
216
-
217
-
218
-
219
 |
 |

at the option of the holder. On January 9, 2008, we closed a second public offering of our 7.25 percent
mandatory convertible preferred stock, Series C, as a result of the underwriters exercising their overallotment
option. We sold 150,000 shares of the preferred stock related to this overallotment and the closing resulted in
net proceeds of $145.5 million. We used approximately $2.0 billion of the net proceeds of the December 31,
2007 closings to settle our outstanding equity forward contract with Citibank and repurchase the
44,039,890 shares of common stock deliverable to us under the contract. On December 31, 2007, the Company
and Citibank agreed to physically settle the contract and the Company paid Citibank approximately
$1.1 billion, the difference between the contract purchase price and the previous market closing price on the
44 million shares. Consequently, the common shares outstanding and shareholders’ equity on the Company’s
year-end balance sheet reflect the shares issued in the public offerings and the physical settlement of the
equity forward contract. As of December 31, 2007, the 44 million shares under this equity forward contract
are reflected in treasury stock. The Company paid Citibank the remaining balance of approximately $0.9 billion
due under the contract on January 9, 2008. The Company now has no outstanding equity forward positions.
The remaining proceeds from the public offerings were used for general corporate purposes.
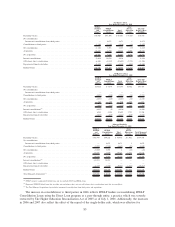
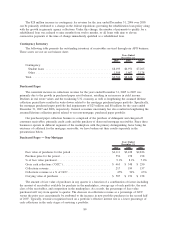
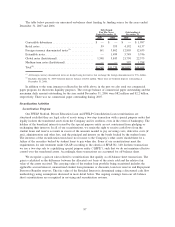
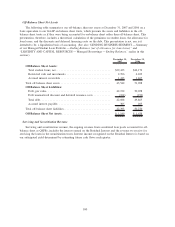
The following table details our primary sources of liquidity and the available capacity at December 31,
2007 and December 31, 2006.
Available Capacity Available Capacity
December 31, 2007 December 31, 2006
Sources of primary liquidity:
Unrestricted cash and liquid investments:
Cash and cash equivalents ....................... $ 7,582 $ 2,621
U.S. Treasury-backed securities ................... 643 1,098
Commercial paper and asset-backed commercial paper . . 1,349 943
Certificates of deposit .......................... 600 —
Other ...................................... 83 58
Total unrestricted cash and liquid investments
(1)
......... 10,257 4,720
Unused commercial paper and bank lines of credit....... 6,500 6,500
ABCP borrowing capacity ......................... 5,933 1,047
Interim ABCP Facility borrowing capacity . . ........... 4,040 —
Total sources of primary liquidity ................... 26,730 12,267
Sources of stand-by liquidity:
Unencumbered FFELP loans ..................... 18,731 28,070
Total sources of primary and stand-by liquidity ......... $45,461 $40,337
(1)
Excludes $196 million and $365 million of investments pledged as collateral related to certain derivative positions and $93 million and
$99 million of other non-liquid investments classified at December 31, 2007 and December 31, 2006, respectively, as cash and invest-
ments on our balance sheet in accordance with GAAP.
We believe our unencumbered FFELP loan portfolio provides a viable source of potential or stand-by
liquidity because of the well-developed market for securitizations and whole loan sales of government
guaranteed student loans. In addition to the assets listed in the table above, we hold on-balance sheet a number
of other unencumbered assets, consisting primarily of Private Education Loans, Retained Interests and other
assets. At December 31, 2007, we had a total of $51.7 billion of unencumbered assets, including goodwill and
acquired intangibles.
In addition to liquidity, a major objective when financing our business is to minimize interest rate risk by
aligning the interest rate and reset characteristics of our Managed assets and liabilities, generally on a pooled
basis, to the extent practicable. In this process we use derivative financial instruments extensively to reduce
our interest rate and foreign currency exposure. This interest rate risk management helps us to stabilize our
student loan spread in various and changing interest rate environments. (See also “RISKS — Interest Rate Risk
Management” below.)
95