Sallie Mae 2007 Annual Report Download - page 150
Download and view the complete annual report
Please find page 150 of the 2007 Sallie Mae annual report below. You can navigate through the pages in the report by either clicking on the pages listed below, or by using the keyword search tool below to find specific information within the annual report.-
 1
1 -
2
-
3
-
4
-
5
-
6
-
7
-
8
-
9
-
10
-
11
-
12
-
13
-
14
-
15
-
16
-
17
-
18
-
19
-
20
-
21
-
22
-
23
-
24
-
25
-
26
-
27
-
28
-
29
-
30
-
31
-
32
-
33
-
34
-
35
-
36
-
37
-
38
-
39
-
40
-
41
-
42
-
43
-
44
-
45
-
46
-
47
-
48
-
49
-
50
-
51
-
52
-
53
-
54
-
55
-
56
-
57
-
58
-
59
-
60
-
61
-
62
-
63
-
64
-
65
-
66
-
67
-
68
-
69
-
70
-
71
-
72
-
73
-
74
-
75
-
76
-
77
-
78
-
79
-
80
-
81
-
82
-
83
-
84
-
85
-
86
-
87
-
88
-
89
-
90
-
91
-
92
-
93
-
94
-
95
-
96
-
97
-
98
-
99
-
100
-
101
-
102
-
103
-
104
-
105
-
106
-
107
-
108
-
109
-
110
-
111
-
112
-
113
-
114
-
115
-
116
-
117
-
118
-
119
-
120
-
121
-
122
-
123
-
124
-
125
-
126
-
127
-
128
-
129
-
130
-
131
-
132
-
133
-
134
-
135
-
136
-
137
-
138
-
139
-
 140
140 -
 141
141 -
 142
142 -
 143
143 -
 144
144 -
 145
145 -
 146
146 -
 147
147 -
 148
148 -
 149
149 -
 150
150 -
 151
151 -
 152
152 -
 153
153 -
 154
154 -
 155
155 -
 156
156 -
 157
157 -
 158
158 -
 159
159 -
 160
160 -
161
-
162
-
163
-
164
-
165
-
166
-
167
-
168
-
169
-
170
-
171
-
172
-
173
-
174
-
175
-
176
-
177
-
178
-
179
-
180
-
181
-
182
-
183
-
184
-
185
-
186
-
187
-
188
-
189
-
190
-
191
-
192
-
193
-
194
-
195
-
196
-
197
-
198
-
199
-
200
-
201
-
202
-
203
-
204
-
205
-
206
-
207
-
208
-
209
-
210
-
211
-
212
-
213
-
214
-
215
-
216
-
217
-
218
-
219
 |
 |

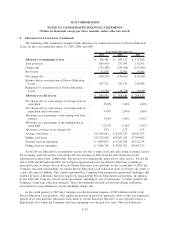
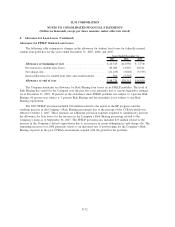
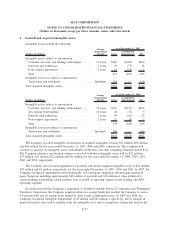
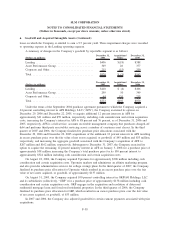
4. Allowance for Loan Losses (Continued)
The following table summarizes changes in the allowance for student loan losses for Private Education
Loans for the years ended December 31, 2007, 2006 and 2005.
2007 2006 2005
Years Ended December 31,
Allowance at beginning of year ................. $ 308,346 $ 204,112 $ 171,886
Total provision ............................... 883,474 257,983 176,782
Charge-offs ................................. (332,188) (159,560) (153,994)
Recoveries .................................. 32,079 22,599 19,366
Net charge-offs .............................. (300,109) (136,961) (134,628)
Balance before securitization of Private Education
Loans .................................... 891,711 325,134 214,040
Reduction for securitization of Private Education
Loans .................................... (5,780) (16,788) (9,928)
Allowance at end of year ...................... $ 885,931 $ 308,346 $ 204,112
Net charge-offs as a percentage of average loans in
repayment ................................ 5.04% 3.22% 4.14%
Net charge-offs as a percentage of average loans in
repayment and forbearance .................... 4.54% 2.99% 3.86%
Allowance as a percentage of the ending total loan
balance................................... 5.64% 3.06% 2.56%
Allowance as a percentage of the ending loans in
repayment ................................ 12.57% 6.36% 5.57%
Allowance coverage of net charge-offs ............. 2.95 2.25 1.52
Average total loans ............................ $12,506,662 $ 8,585,270 $6,921,975
Ending total loans ............................ $15,703,656 $10,063,635 $7,960,882
Average loans in repayment ..................... $ 5,949,007 $ 4,256,780 $3,252,238
Ending loans in repayment ...................... $ 7,046,709 $ 4,851,305 $3,662,255
As the Private Education Loan portfolio seasons and due to shifts in its mix and certain economic factors,
the Company expected and has seen charge-off rates increase in 2007 from the historically low levels
experienced in prior years. Additionally, this increase was significantly impacted by other factors. Toward the
end of 2006 and through mid-2007, the Company experienced lower pre-default collections, resulting in
increased levels of charge-off activity in its Private Education Loan portfolio. In the second half of 2006, the
Company relocated responsibility for certain Private Education Loan collections from its Nevada call center to
a new call center in Indiana. This transfer presented the Company with unexpected operational challenges that
resulted in lower collections that have negatively impacted the Private Education Loan portfolio. In addition,
in late 2006, the Company revised certain procedures, including its use of forbearance, to better optimize the
Company’s long-term collection strategies. These developments resulted in lower pre-default collections,
increased later stage delinquency levels and higher charge-offs.
In the fourth quarter of 2007 the Company recorded provision expense of $503 million related to the
Private Education Loan portfolio. This significant increase in provision primarily relates to the non-traditional
portion of its loan portfolio (education loans made to certain borrowers that have or are expected to have a
high default rate) which the Company had been expanding over the past few years. The non-traditional
F-29
SLM CORPORATION
NOTES TO CONSOLIDATED FINANCIAL STATEMENTS
(Dollars in thousands, except per share amounts, unless otherwise stated)