Sallie Mae 2007 Annual Report Download - page 63
Download and view the complete annual report
Please find page 63 of the 2007 Sallie Mae annual report below. You can navigate through the pages in the report by either clicking on the pages listed below, or by using the keyword search tool below to find specific information within the annual report.-
 1
1 -
2
-
3
-
4
-
5
-
6
-
7
-
8
-
9
-
10
-
11
-
12
-
13
-
14
-
15
-
16
-
17
-
18
-
19
-
20
-
21
-
22
-
23
-
24
-
25
-
26
-
27
-
28
-
29
-
30
-
31
-
32
-
33
-
34
-
35
-
36
-
37
-
38
-
39
-
40
-
41
-
42
-
43
-
44
-
45
-
46
-
47
-
48
-
49
-
50
-
51
-
52
-
 53
53 -
 54
54 -
 55
55 -
 56
56 -
 57
57 -
 58
58 -
 59
59 -
 60
60 -
 61
61 -
 62
62 -
 63
63 -
 64
64 -
 65
65 -
 66
66 -
 67
67 -
 68
68 -
 69
69 -
 70
70 -
 71
71 -
 72
72 -
 73
73 -
74
-
75
-
76
-
77
-
78
-
79
-
80
-
81
-
82
-
83
-
84
-
85
-
86
-
87
-
88
-
89
-
90
-
91
-
92
-
93
-
94
-
95
-
96
-
97
-
98
-
99
-
100
-
101
-
102
-
103
-
104
-
105
-
106
-
107
-
108
-
109
-
110
-
111
-
112
-
113
-
114
-
115
-
116
-
117
-
118
-
119
-
120
-
121
-
122
-
123
-
124
-
125
-
126
-
127
-
128
-
129
-
130
-
131
-
132
-
133
-
134
-
135
-
136
-
137
-
138
-
139
-
140
-
141
-
142
-
143
-
144
-
145
-
146
-
147
-
148
-
149
-
150
-
151
-
152
-
153
-
154
-
155
-
156
-
157
-
158
-
159
-
160
-
161
-
162
-
163
-
164
-
165
-
166
-
167
-
168
-
169
-
170
-
171
-
172
-
173
-
174
-
175
-
176
-
177
-
178
-
179
-
180
-
181
-
182
-
183
-
184
-
185
-
186
-
187
-
188
-
189
-
190
-
191
-
192
-
193
-
194
-
195
-
196
-
197
-
198
-
199
-
200
-
201
-
202
-
203
-
204
-
205
-
206
-
207
-
208
-
209
-
210
-
211
-
212
-
213
-
214
-
215
-
216
-
217
-
218
-
219
 |
 |

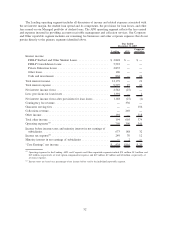
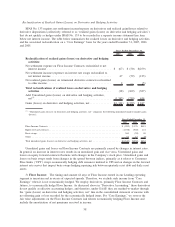
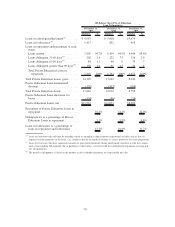
Average Balances:
FFELP
Stafford and
Other
(1)
FFELP
Consolidation
Loans Total FFELP
Private
Education
Loans Total
Year Ended December 31, 2007
On-balance sheet ............ $31,294 $67,918 $ 99,212 $12,507 $111,719
Off-balance sheet ............ 11,533 17,195 28,728 13,683 42,411
Total Managed .............. $42,827 $85,113 $127,940 $26,190 $154,130
% of on-balance sheet FFELP . . . 32% 68% 100%
% of Managed FFELP ........ 33% 67% 100%
% of total ................. 28% 55% 83% 17% 100%
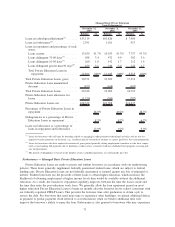
FFELP
Stafford and
Other
(1)
FFELP
Consolidation
Loans Total FFELP
Private
Education
Loans Total
Year Ended December 31, 2006
On-balance sheet ............ $21,152 $55,119 $ 76,271 $ 8,585 $ 84,856
Off-balance sheet ............ 19,546 15,652 35,198 11,138 46,336
Total Managed .............. $40,698 $70,771 $111,469 $19,723 $131,192
% of on-balance sheet FFELP . . . 28% 72% 100%
% of Managed FFELP ........ 37% 63% 100%
% of total ................. 31% 54% 85% 15% 100%
FFELP
Stafford and
Other
(1)
FFELP
Consolidation
Loans Total FFELP
Private
Education
Loans Total
Year Ended December 31, 2005
On-balance sheet ............ $20,720 $47,082 $ 67,802 $ 6,922 $ 74,724
Off-balance sheet ............ 24,182 9,800 33,982 7,238 41,220
Total Managed .............. $44,902 $56,882 $101,784 $14,160 $115,944
% of on-balance sheet FFELP . . . 31% 69% 100%
% of Managed FFELP ........ 44% 56% 100%
% of total ................. 39% 49% 88% 12% 100%
(1)
FFELP category is primarily Stafford loans and also includes federally insured PLUS and HEAL loans.
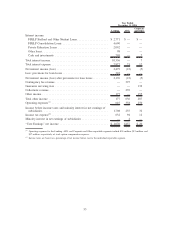
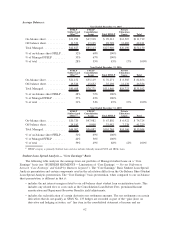
Student Loan Spread Analysis — “Core Earnings” Basis
The following table analyzes the earnings from our portfolio of Managed student loans on a “Core
Earnings” basis (see “BUSINESS SEGMENTS — Limitations of ‘Core Earnings’ — Pre-tax Differences
between ‘Core Earnings’ and GAAP by Business Segment”). The “Core Earnings” Basis Student Loan Spread
Analysis presentation and certain components used in the calculation differ from the On-Balance Sheet Student
Loan Spread Analysis presentation. The “Core Earnings” basis presentation, when compared to our on-balance
sheet presentation, is different in that it:
• includes the net interest margin related to our off-balance sheet student loan securitization trusts. This
includes any related fees or costs such as the Consolidation Loan Rebate Fees, premium/discount
amortization and Repayment Borrower Benefits yield adjustments;
• includes the reclassification of certain derivative net settlement amounts. The net settlements on certain
derivatives that do not qualify as SFAS No. 133 hedges are recorded as part of the “gain (loss) on
derivative and hedging activities, net” line item in the consolidated statement of income and are
62