Sallie Mae 2007 Annual Report Download - page 61
Download and view the complete annual report
Please find page 61 of the 2007 Sallie Mae annual report below. You can navigate through the pages in the report by either clicking on the pages listed below, or by using the keyword search tool below to find specific information within the annual report.-
 1
1 -
2
-
3
-
4
-
5
-
6
-
7
-
8
-
9
-
10
-
11
-
12
-
13
-
14
-
15
-
16
-
17
-
18
-
19
-
20
-
21
-
22
-
23
-
24
-
25
-
26
-
27
-
28
-
29
-
30
-
31
-
32
-
33
-
34
-
35
-
36
-
37
-
38
-
39
-
40
-
41
-
42
-
43
-
44
-
45
-
46
-
47
-
48
-
49
-
50
-
 51
51 -
 52
52 -
 53
53 -
 54
54 -
 55
55 -
 56
56 -
 57
57 -
 58
58 -
 59
59 -
 60
60 -
 61
61 -
 62
62 -
 63
63 -
 64
64 -
 65
65 -
 66
66 -
 67
67 -
 68
68 -
 69
69 -
 70
70 -
 71
71 -
72
-
73
-
74
-
75
-
76
-
77
-
78
-
79
-
80
-
81
-
82
-
83
-
84
-
85
-
86
-
87
-
88
-
89
-
90
-
91
-
92
-
93
-
94
-
95
-
96
-
97
-
98
-
99
-
100
-
101
-
102
-
103
-
104
-
105
-
106
-
107
-
108
-
109
-
110
-
111
-
112
-
113
-
114
-
115
-
116
-
117
-
118
-
119
-
120
-
121
-
122
-
123
-
124
-
125
-
126
-
127
-
128
-
129
-
130
-
131
-
132
-
133
-
134
-
135
-
136
-
137
-
138
-
139
-
140
-
141
-
142
-
143
-
144
-
145
-
146
-
147
-
148
-
149
-
150
-
151
-
152
-
153
-
154
-
155
-
156
-
157
-
158
-
159
-
160
-
161
-
162
-
163
-
164
-
165
-
166
-
167
-
168
-
169
-
170
-
171
-
172
-
173
-
174
-
175
-
176
-
177
-
178
-
179
-
180
-
181
-
182
-
183
-
184
-
185
-
186
-
187
-
188
-
189
-
190
-
191
-
192
-
193
-
194
-
195
-
196
-
197
-
198
-
199
-
200
-
201
-
202
-
203
-
204
-
205
-
206
-
207
-
208
-
209
-
210
-
211
-
212
-
213
-
214
-
215
-
216
-
217
-
218
-
219
 |
 |

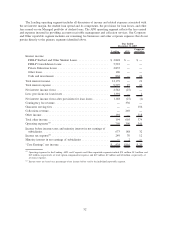
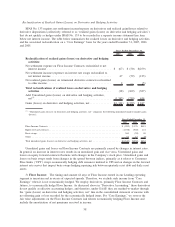
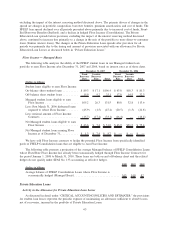
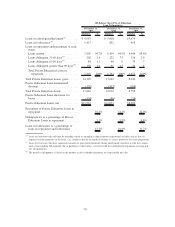
The following table includes the “Core Earnings” results of operations for our Lending business segment.
2007 2006 2005 2007 vs. 2006 2006 vs. 2005
Years Ended December 31, % Increase (Decrease)
“Core Earnings” interest income:
FFELP Stafford and Other Student
Loans ..................... $ 2,848 $ 2,771 $2,298 3% 21%
FFELP Consolidation Loans ...... 5,522 4,690 3,014 18 56
Private Education Loans ......... 2,835 2,092 1,160 36 80
Other loans ................... 106 98 85 8 15
Cash and investments ........... 868 705 396 23 78
Total “Core Earnings” interest
income ...................... 12,179 10,356 6,953 18 49
Total “Core Earnings” interest
expense...................... 9,597 7,877 4,798 22 64
Net “Core Earnings” interest income . . 2,582 2,479 2,155 4 15
Less: provisions for loan losses ...... 1,394 303 138 360 120
Net “Core Earnings” interest income
after provisions for loan losses..... 1,188 2,176 2,017 45 8
Other income ................... 194 177 111 10 59
Operating expenses ............... 709 645 547 10 18
Income before income taxes and
minority interest in net earnings of
subsidiaries ................... 673 1,708 1,581 (61) 8
Income taxes ................... 249 632 586 (61) 8
Income before minority interest in net
earnings of subsidiaries .......... 424 1,076 995 (61) 8
Minority interest in net earnings of
subsidiaries ................... — — 2 — (100)
“Core Earnings” net income ....... $ 424 $ 1,076 $ 993 (61)% 8%
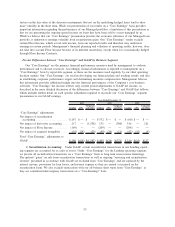
The changes in net interest income are primarily due to fluctuations in the student loan spread discussed
below, as well as the growth in our student loan portfolio and the level of cash and investments we may hold
on our balance sheet for liquidity purposes. In connection with the Merger Agreement, we increased our
liquidity portfolio to higher than historical levels. The liquidity portfolio has a negative net interest margin,
and as a result, the increase in this portfolio reduced net interest income by $18 million for the year ended
December 31, 2007.
60