Sallie Mae 2007 Annual Report Download - page 174
Download and view the complete annual report
Please find page 174 of the 2007 Sallie Mae annual report below. You can navigate through the pages in the report by either clicking on the pages listed below, or by using the keyword search tool below to find specific information within the annual report.-
 1
1 -
2
-
3
-
4
-
5
-
6
-
7
-
8
-
9
-
10
-
11
-
12
-
13
-
14
-
15
-
16
-
17
-
18
-
19
-
20
-
21
-
22
-
23
-
24
-
25
-
26
-
27
-
28
-
29
-
30
-
31
-
32
-
33
-
34
-
35
-
36
-
37
-
38
-
39
-
40
-
41
-
42
-
43
-
44
-
45
-
46
-
47
-
48
-
49
-
50
-
51
-
52
-
53
-
54
-
55
-
56
-
57
-
58
-
59
-
60
-
61
-
62
-
63
-
64
-
65
-
66
-
67
-
68
-
69
-
70
-
71
-
72
-
73
-
74
-
75
-
76
-
77
-
78
-
79
-
80
-
81
-
82
-
83
-
84
-
85
-
86
-
87
-
88
-
89
-
90
-
91
-
92
-
93
-
94
-
95
-
96
-
97
-
98
-
99
-
100
-
101
-
102
-
103
-
104
-
105
-
106
-
107
-
108
-
109
-
110
-
111
-
112
-
113
-
114
-
115
-
116
-
117
-
118
-
119
-
120
-
121
-
122
-
123
-
124
-
125
-
126
-
127
-
128
-
129
-
130
-
131
-
132
-
133
-
134
-
135
-
136
-
137
-
138
-
139
-
140
-
141
-
142
-
143
-
144
-
145
-
146
-
147
-
148
-
149
-
150
-
151
-
152
-
153
-
154
-
155
-
156
-
157
-
158
-
159
-
160
-
161
-
162
-
163
-
 164
164 -
 165
165 -
 166
166 -
 167
167 -
 168
168 -
 169
169 -
 170
170 -
 171
171 -
 172
172 -
 173
173 -
 174
174 -
 175
175 -
 176
176 -
 177
177 -
 178
178 -
 179
179 -
 180
180 -
 181
181 -
 182
182 -
 183
183 -
 184
184 -
185
-
186
-
187
-
188
-
189
-
190
-
191
-
192
-
193
-
194
-
195
-
196
-
197
-
198
-
199
-
200
-
201
-
202
-
203
-
204
-
205
-
206
-
207
-
208
-
209
-
210
-
211
-
212
-
213
-
214
-
215
-
216
-
217
-
218
-
219
 |
 |

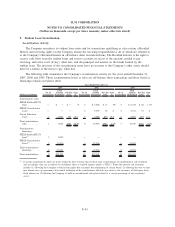
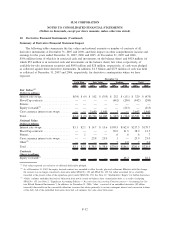
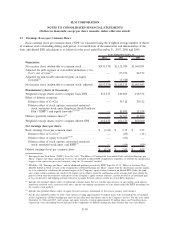
10. Derivative Financial Instruments (Continued)
2007 2006 2005 2007 2006 2005 2007 2006 2005 2007 2006 2005
Cash Flow Fair Value Trading Total
Years Ended December 31,
(Dollars in millions)
Change in fair value of cash flow
hedges . . .................... $(16) $ (7) $(27) $— $— $— $ — $ — $ — $ (16) $ (7) $ (27)
Amortization of effective hedges
(1)
...... 1 12 25 — — — — — — 1 12 25
Discontinued hedges ............... — — 15 — — — — — — — — 15
Change in accumulated other
comprehensive income, net ......... $(15) $ 5 $ 13 $— $— $— $ — $ — $ — $ (15) $ 5 $ 13
Earnings Summary
Amortization of closed futures contracts’
gains/losses in interest expense
(2)
..... $ (2) $(19) $(39) $— $— $— $ — $ — $ — $ (2) $ (19) $ (39)
Gains (losses) on derivative and hedging
activities — Realized
(3)
............ — — — — — — (18) (109) (387) (18) (109) (387)
Gains (losses) on derivative and hedging
activities — Unrealized . . .......... — — — 60
(4)
13
(4)
(3)
(4)
(1,403) (243) 637 (1,343) (230) 634
Total earnings impact .............. $ (2) $(19) $(39) $60 $13 $ (3) $(1,421) $(352) $ 250 $(1,363) $(358) $ 208
(1)
The Company expects to amortize $.1 million of after-tax net losses from accumulated other comprehensive income to earnings during
the next 12 months related to closed futures contracts that were hedging the forecasted issuance of debt instruments that are outstand-
ing as of December 31, 2007.
(2)
For futures contracts that qualify as SFAS No. 133 hedges where the hedged transaction occurs.
(3)
Includes net settlement income/expense related to trading derivatives and realized gains and losses related to derivative dispositions.
(4)
The change in fair value of cash flow and fair value hedges represents amounts related to ineffectiveness.
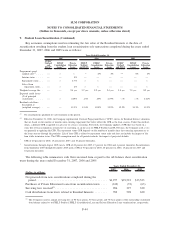
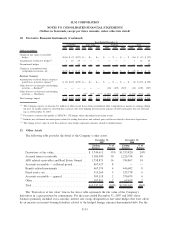
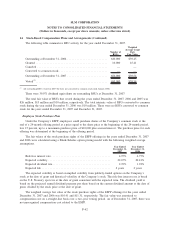
11. Other Assets
The following table provides the detail of the Company’s other assets.
Ending
Balance
%of
Balance
Ending
Balance
%of
Balance
December 31,
2007
December 31,
2006
Derivatives at fair value ..................... $ 3,744,611 35% $1,353,820 24%
Accrued interest receivable .................. 3,180,590 30 2,226,758 40
APG related receivables and Real Estate Owned . . 1,758,871 16 794,867 14
Accounts receivable — collateral posted ......... 867,427 8 — —
Benefit-related investments .................. 467,379 4 446,602 8
Fixed assets, net .......................... 315,260 3 323,778 6
Accounts receivable — general ............... 305,118 2 370,679 6
Other .................................. 107,851 2 69,439 2
Total ................................... $10,747,107 100% $5,585,943 100%
The “Derivatives at fair value” line in the above table represents the fair value of the Company’s
derivatives in a gain position by counterparty. For the years ended December 31, 2007 and 2006, these
balances primarily included cross-currency interest rate swaps designated as fair value hedges that were offset
by an increase in interest-bearing liabilities related to the hedged foreign currency-denominated debt. For the
F-53
SLM CORPORATION
NOTES TO CONSOLIDATED FINANCIAL STATEMENTS
(Dollars in thousands, except per share amounts, unless otherwise stated)