Sallie Mae 2007 Annual Report Download - page 181
Download and view the complete annual report
Please find page 181 of the 2007 Sallie Mae annual report below. You can navigate through the pages in the report by either clicking on the pages listed below, or by using the keyword search tool below to find specific information within the annual report.-
 1
1 -
2
-
3
-
4
-
5
-
6
-
7
-
8
-
9
-
10
-
11
-
12
-
13
-
14
-
15
-
16
-
17
-
18
-
19
-
20
-
21
-
22
-
23
-
24
-
25
-
26
-
27
-
28
-
29
-
30
-
31
-
32
-
33
-
34
-
35
-
36
-
37
-
38
-
39
-
40
-
41
-
42
-
43
-
44
-
45
-
46
-
47
-
48
-
49
-
50
-
51
-
52
-
53
-
54
-
55
-
56
-
57
-
58
-
59
-
60
-
61
-
62
-
63
-
64
-
65
-
66
-
67
-
68
-
69
-
70
-
71
-
72
-
73
-
74
-
75
-
76
-
77
-
78
-
79
-
80
-
81
-
82
-
83
-
84
-
85
-
86
-
87
-
88
-
89
-
90
-
91
-
92
-
93
-
94
-
95
-
96
-
97
-
98
-
99
-
100
-
101
-
102
-
103
-
104
-
105
-
106
-
107
-
108
-
109
-
110
-
111
-
112
-
113
-
114
-
115
-
116
-
117
-
118
-
119
-
120
-
121
-
122
-
123
-
124
-
125
-
126
-
127
-
128
-
129
-
130
-
131
-
132
-
133
-
134
-
135
-
136
-
137
-
138
-
139
-
140
-
141
-
142
-
143
-
144
-
145
-
146
-
147
-
148
-
149
-
150
-
151
-
152
-
153
-
154
-
155
-
156
-
157
-
158
-
159
-
160
-
161
-
162
-
163
-
164
-
165
-
166
-
167
-
168
-
169
-
170
-
 171
171 -
 172
172 -
 173
173 -
 174
174 -
 175
175 -
 176
176 -
 177
177 -
 178
178 -
 179
179 -
 180
180 -
 181
181 -
 182
182 -
 183
183 -
 184
184 -
 185
185 -
 186
186 -
 187
187 -
 188
188 -
 189
189 -
 190
190 -
 191
191 -
192
-
193
-
194
-
195
-
196
-
197
-
198
-
199
-
200
-
201
-
202
-
203
-
204
-
205
-
206
-
207
-
208
-
209
-
210
-
211
-
212
-
213
-
214
-
215
-
216
-
217
-
218
-
219
 |
 |

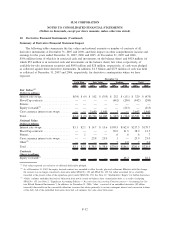
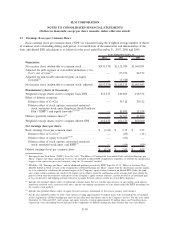
14. Stock-Based Compensation Plans and Arrangements (Continued)
Under the Directors Stock Plan, the maximum term for stock options is 10 years and the exercise price
must be equal to or greater than the market price of the Company’s common stock on the date of grant. Stock
options granted to directors are generally subject to the following vesting schedule: all options vest upon the
Company’s common stock price reaching a closing price equal to or greater than 20 percent above the fair
market value of the common stock on the date of grant for five days or the director’s election to the Board,
whichever occurs later. In any event, all options vest upon the fifth anniversary of their grant date.
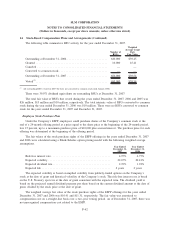
The fair values of the options granted in the years ended December 31, 2007, 2006 and 2005 were
estimated as of the date of grant using a Black-Scholes option pricing model with the following weighted
average assumptions.
2007 2006 2005
Years Ended December 31,
Risk-free interest rate . ................................... 4.88% 4.75% 3.87%
Expected volatility . . .................................... 21.10% 20.22% 21.48%
Expected dividend rate ................................... 2.20% 1.72% 1.58%
Expected life of the option ................................ 3years 3 years 3 years
The expected life of the options is based on observed historical exercise patterns. Groups of employees
that have received similar option grant terms were considered separately for valuation purposes. The expected
volatility is based on implied volatility from publicly-traded options on the Company’s stock at the date of
grant and historical volatility of the Company’s stock. The risk-free interest rate is based on the U.S. Treasury
spot rate at the date of grant consistent with the expected term of the option. The dividend yield is based on
the projected annual dividend payment per share based on the dividend amount at the date of grant, divided by
the stock price at the date of grant.
As of December 31, 2007, there was $13 million of unrecognized compensation cost related to stock
options, which is expected to be recognized over a weighted average period of .8 years.
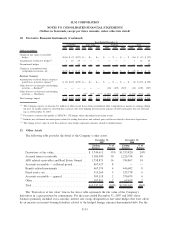
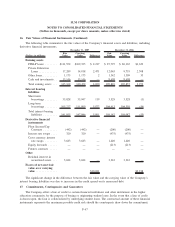
The following table summarizes stock option activity for the year ended December 31, 2007.
Number of
Options
Weighted
Average
Exercise
Price per
Share
Weighted
Average
Remaining
Contractual
Term
Aggregate
Intrinsic
Value
Outstanding at December 31, 2006 ............ 41,022,878 $37.85
Granted ................................ 3,784,600 45.41
Exercised .............................. (6,635,644) 27.66
Canceled ............................... (1,513,070) 51.15
Outstanding at December 31, 2007
(1)
.......... 36,658,764 $39.92 6.09 yrs $0
Exercisable at December 31, 2007 ............ 25,357,909 $35.14 5.20 yrs $0
(1)
Includes gross number of net-settled options awarded. Options granted in 2007 were granted as net-settled options. Upon exercise of a
net-settled option, employees are entitled to receive the after-tax spread shares only. The spread shares equal the gross number of
options granted less shares for the option cost. Shares for the option cost equal the option price multiplied by the number of gross
options exercised divided by the fair market value of SLM common stock at the time of exercise.
The weighted average fair value of options granted was $7.89, $9.34 and $8.69 for the years ended
December 31, 2007, 2006 and 2005, respectively. The total intrinsic value of options exercised was
F-60
SLM CORPORATION
NOTES TO CONSOLIDATED FINANCIAL STATEMENTS
(Dollars in thousands, except per share amounts, unless otherwise stated)