Sallie Mae 2007 Annual Report Download - page 69
Download and view the complete annual report
Please find page 69 of the 2007 Sallie Mae annual report below. You can navigate through the pages in the report by either clicking on the pages listed below, or by using the keyword search tool below to find specific information within the annual report.-
 1
1 -
2
-
3
-
4
-
5
-
6
-
7
-
8
-
9
-
10
-
11
-
12
-
13
-
14
-
15
-
16
-
17
-
18
-
19
-
20
-
21
-
22
-
23
-
24
-
25
-
26
-
27
-
28
-
29
-
30
-
31
-
32
-
33
-
34
-
35
-
36
-
37
-
38
-
39
-
40
-
41
-
42
-
43
-
44
-
45
-
46
-
47
-
48
-
49
-
50
-
51
-
52
-
53
-
54
-
55
-
56
-
57
-
58
-
 59
59 -
 60
60 -
 61
61 -
 62
62 -
 63
63 -
 64
64 -
 65
65 -
 66
66 -
 67
67 -
 68
68 -
 69
69 -
 70
70 -
 71
71 -
 72
72 -
 73
73 -
 74
74 -
 75
75 -
 76
76 -
 77
77 -
 78
78 -
 79
79 -
80
-
81
-
82
-
83
-
84
-
85
-
86
-
87
-
88
-
89
-
90
-
91
-
92
-
93
-
94
-
95
-
96
-
97
-
98
-
99
-
100
-
101
-
102
-
103
-
104
-
105
-
106
-
107
-
108
-
109
-
110
-
111
-
112
-
113
-
114
-
115
-
116
-
117
-
118
-
119
-
120
-
121
-
122
-
123
-
124
-
125
-
126
-
127
-
128
-
129
-
130
-
131
-
132
-
133
-
134
-
135
-
136
-
137
-
138
-
139
-
140
-
141
-
142
-
143
-
144
-
145
-
146
-
147
-
148
-
149
-
150
-
151
-
152
-
153
-
154
-
155
-
156
-
157
-
158
-
159
-
160
-
161
-
162
-
163
-
164
-
165
-
166
-
167
-
168
-
169
-
170
-
171
-
172
-
173
-
174
-
175
-
176
-
177
-
178
-
179
-
180
-
181
-
182
-
183
-
184
-
185
-
186
-
187
-
188
-
189
-
190
-
191
-
192
-
193
-
194
-
195
-
196
-
197
-
198
-
199
-
200
-
201
-
202
-
203
-
204
-
205
-
206
-
207
-
208
-
209
-
210
-
211
-
212
-
213
-
214
-
215
-
216
-
217
-
218
-
219
 |
 |

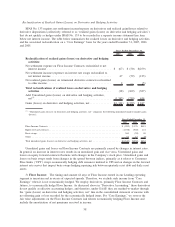
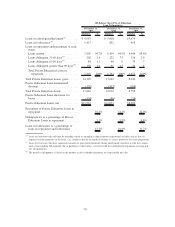
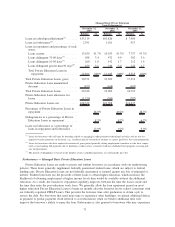
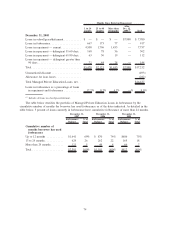
The following table provides the detail for the traditional and non-traditional Managed Private Education
Loans at December 31, 2007. As noted above, we have not used these terms in prior filings with the SEC in
our Annual Report on Form 10-K and quarterly reports on Form 10-Q, but believe these new measures will
provide additional information regarding the actual and projected performance of the Private Education Loan
portfolios that include non-traditional loans. Because we have not measured or reported the performance of
our Managed Private Education Loans in terms of traditional and non-traditional loans in the past, we have
extrapolated the data for 2006 based upon our recent analyses solely for comparative purposes.
Traditional
Non-
Traditional Total Traditional
Non-
Traditional Total
2007 2006
Ending total loans (before
allowance) .......... $25,092 $4,456 $29,548 $19,533 $3,449 $22,982
Private Education Loan
allowance for losses . . . 438 782 1,220 179 215 394
Net charge-offs as a
percentage of average
loans in repayment .... 1.50% 11.93% 3.07% .63% 7.17% 1.62%
Allowance as a percentage
of total ending loan
balance ............. 1.75% 17.56% 4.13% .91% 6.24% 1.71%
Allowance as a percentage
of ending loans in
repayment ........... 3.45% 36.30% 8.21% 1.82% 11.82% 3.38%
Average coverage of net
charge-offs .......... 2.58 3.30 3.00 3.33 2.01 2.44
68