PNC Bank 2008 Annual Report Download - page 88
Download and view the complete annual report
Please find page 88 of the 2008 PNC Bank annual report below. You can navigate through the pages in the report by either clicking on the pages listed below, or by using the keyword search tool below to find specific information within the annual report.-
 1
1 -
2
-
3
-
4
-
5
-
6
-
7
-
8
-
9
-
10
-
11
-
12
-
13
-
14
-
15
-
16
-
17
-
18
-
19
-
20
-
21
-
22
-
23
-
24
-
25
-
26
-
27
-
28
-
29
-
30
-
31
-
32
-
33
-
34
-
35
-
36
-
37
-
38
-
39
-
40
-
41
-
42
-
43
-
44
-
45
-
46
-
47
-
48
-
49
-
50
-
51
-
52
-
53
-
54
-
55
-
56
-
57
-
58
-
59
-
60
-
61
-
62
-
63
-
64
-
65
-
66
-
67
-
68
-
69
-
70
-
71
-
72
-
73
-
74
-
75
-
76
-
77
-
 78
78 -
 79
79 -
 80
80 -
 81
81 -
 82
82 -
 83
83 -
 84
84 -
 85
85 -
 86
86 -
 87
87 -
 88
88 -
 89
89 -
 90
90 -
 91
91 -
 92
92 -
 93
93 -
 94
94 -
 95
95 -
 96
96 -
 97
97 -
 98
98 -
99
-
100
-
101
-
102
-
103
-
104
-
105
-
106
-
107
-
108
-
109
-
110
-
111
-
112
-
113
-
114
-
115
-
116
-
117
-
118
-
119
-
120
-
121
-
122
-
123
-
124
-
125
-
126
-
127
-
128
-
129
-
130
-
131
-
132
-
133
-
134
-
135
-
136
-
137
-
138
-
139
-
140
-
141
-
142
-
143
-
144
-
145
-
146
-
147
-
148
-
149
-
150
-
151
-
152
-
153
-
154
-
155
-
156
-
157
-
158
-
159
-
160
-
161
-
162
-
163
-
164
-
165
-
166
-
167
-
168
-
169
-
170
-
171
-
172
-
173
-
174
-
175
-
176
-
177
-
178
-
179
-
180
-
181
-
182
-
183
-
184
 |
 |

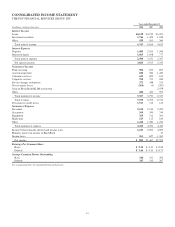
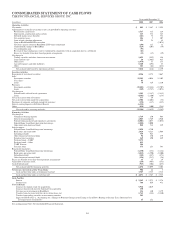
CONSOLIDATED STATEMENT OF CASH FLOWS
THE PNC FINANCIAL SERVICES GROUP, INC.
Year ended December 31
In millions 2008 2007 2006
Operating Activities
Net income $ 882 $ 1,467 $ 2,595
Adjustments to reconcile net income to net cash provided by operating activities
Provision for credit losses 1,517 315 124
Depreciation, amortization and accretion 325 332 345
Deferred income taxes (benefit) (261) 78 752
Net securities losses 206 5 207
Loan related valuation adjustments 253 24 45
Gain on BlackRock/MLIM transaction (2,078)
Net losses (gains) related to BlackRock LTIP shares adjustment (246) 127 12
Undistributed earnings of BlackRock (129) (207) (39)
Visa redemption gain (95)
Reversal of legal contingency reserve established in connection with an acquisition due to a settlement (61)
Excess tax benefits from share-based payment arrangements (13) (15) (29)
Net change in
Trading securities and other short-term investments 1,459 (552) 156
Loans held for sale 50 (1,465) 435
Other assets (1,974) 37 173
Accrued expenses and other liabilities 5,140 (498) 83
Other 361 (64) (622)
Net cash provided (used) by operating activities 7,414 (416) 2,159
Investing Activities
Repayment of investment securities 4,246 4,374 3,667
Sales
Investment securities 10,283 6,056 11,102
Visa shares 95
Loans 76 329 1,110
Purchases
Investment securities (19,482) (15,884) (15,707)
Loans (249) (2,747) (3,072)
Net change in
Federal funds sold and resale agreements 1,301 (1,147) (1,413)
Loans (4,595) (2,160) (278)
Net cash received from divestitures 377 59
Net cash received from (paid for) acquisitions 2,384 (2,602) (58)
Purchases of corporate and bank-owned life insurance (350) (117) (425)
Interest-earning deposits with Federal Reserve (6,234)
Other (838) (800) (288)
Net cash used by investing activities (12,986) (14,639) (5,362)
Financing Activities
Net change in
Noninterest-bearing deposits 1,719 230 968
Interest-bearing deposits 2,065 1,769 4,940
Federal funds purchased and repurchase agreements (8,081) 4,057 (1,058)
Federal Home Loan Bank short-term borrowings (2,000) 2,000
Other short-term borrowed funds 840 514 239
Sales/issuances
Federal Home Loan Bank long-term borrowings 5,050 4,750
Bank notes and senior debt 3,626 4,523 1,964
Subordinated debt 759 943
Other long-term borrowed funds 96 250 279
Perpetual trust securities 369 490 489
Preferred stock – TARP 7,275
Preferred stock – Other 492
TARP Warrant 304
Treasury stock 375 253 343
Repayments/maturities
Federal Home Loan Bank long-term borrowings (1,158) (232) (1,124)
Bank notes and senior debt (3,815) (1,590) (2,200)
Subordinated debt (140) (887) (471)
Other long-term borrowed funds (156) (217) (26)
Excess tax benefits from share-based payment arrangements 13 15 29
Acquisition of treasury stock (234) (963) (531)
Cash dividends paid (923) (806) (633)
Net cash provided by financing activities 6,476 15,099 3,208
Net Increase In Cash And Due From Banks 904 44 5
Cash and due from banks at beginning of period 3,567 3,523 3,518
Cash and due from banks at end of period $ 4,471 $ 3,567 $ 3,523
Cash Paid For
Interest $ 2,145 $ 2,973 $ 2,376
Income taxes 706 659 471
Non-cash Items
Issuance of common stock for acquisitions 5,916 4,019
Issuance of preferred stock for National City acquisition 150
Net increase in investment in BlackRock 126 180 3,179
Transfer from (to) loans held for sale to (from) loans, net 1,763 (288) (2,280)
Transfer from trading securities to investment securities 599
Impact of FSP FAS 13-2, “Accounting for a Change or Projected Change in the Timing of Cash Flows Relating to Income Taxes Generated by a
Leveraged Lease Transaction” 15 252
See accompanying Notes To Consolidated Financial Statements.
84