PNC Bank 2008 Annual Report Download - page 52
Download and view the complete annual report
Please find page 52 of the 2008 PNC Bank annual report below. You can navigate through the pages in the report by either clicking on the pages listed below, or by using the keyword search tool below to find specific information within the annual report.-
 1
1 -
2
-
3
-
4
-
5
-
6
-
7
-
8
-
9
-
10
-
11
-
12
-
13
-
14
-
15
-
16
-
17
-
18
-
19
-
20
-
21
-
22
-
23
-
24
-
25
-
26
-
27
-
28
-
29
-
30
-
31
-
32
-
33
-
34
-
35
-
36
-
37
-
38
-
39
-
40
-
41
-
 42
42 -
 43
43 -
 44
44 -
 45
45 -
 46
46 -
 47
47 -
 48
48 -
 49
49 -
 50
50 -
 51
51 -
 52
52 -
 53
53 -
 54
54 -
 55
55 -
 56
56 -
 57
57 -
 58
58 -
 59
59 -
 60
60 -
 61
61 -
 62
62 -
63
-
64
-
65
-
66
-
67
-
68
-
69
-
70
-
71
-
72
-
73
-
74
-
75
-
76
-
77
-
78
-
79
-
80
-
81
-
82
-
83
-
84
-
85
-
86
-
87
-
88
-
89
-
90
-
91
-
92
-
93
-
94
-
95
-
96
-
97
-
98
-
99
-
100
-
101
-
102
-
103
-
104
-
105
-
106
-
107
-
108
-
109
-
110
-
111
-
112
-
113
-
114
-
115
-
116
-
117
-
118
-
119
-
120
-
121
-
122
-
123
-
124
-
125
-
126
-
127
-
128
-
129
-
130
-
131
-
132
-
133
-
134
-
135
-
136
-
137
-
138
-
139
-
140
-
141
-
142
-
143
-
144
-
145
-
146
-
147
-
148
-
149
-
150
-
151
-
152
-
153
-
154
-
155
-
156
-
157
-
158
-
159
-
160
-
161
-
162
-
163
-
164
-
165
-
166
-
167
-
168
-
169
-
170
-
171
-
172
-
173
-
174
-
175
-
176
-
177
-
178
-
179
-
180
-
181
-
182
-
183
-
184
 |
 |
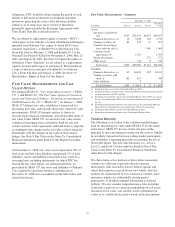
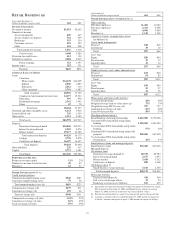
(d) Includes nonperforming loans of $605 million at December 31, 2008 and $215
million at December 31, 2007.
(e) Excludes certain satellite branches that provide limited products and service hours.
(f) Excludes brokerage account assets.
(g) Calculated as of origination date.
(h) Represents the most recent FICO scores that we have on file.
(i) The increase at December 31, 2008 compared with December 31, 2007 reflected
large customer deposit activity in the last few days of December 2008.
(j) Represents small business balances. These balances are swept into liquidity products
managed by other PNC business segments, the majority of which are off-balance
sheet.
(k) Financial consultants provide services in full service brokerage offices and PNC
traditional branches.
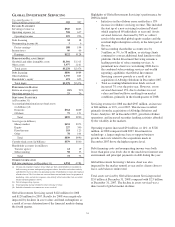
The acquisition of National City on December 31, 2008 added
1,441 branches, including 61 branches that we committed to
divest, and 2,191 ATMs to our distribution network. Including
the impact of National City, our network grew to 2,589
branches and 6,232 ATM machines, giving PNC one of the
largest distribution networks among US banks. The
acquisition also added $53 billion of assets under management
to give the combined company $110 billion in assets under
management.
All other Retail Banking business segment disclosures in this
Item 7 exclude any impact of National City.
Retail Banking’s earnings were $429 million for 2008
compared with $876 million for 2007. The decline in earnings
over the prior year was primarily driven by increases in the
provision for credit losses and noninterest expense. The 2008
revenue growth was negatively impacted by a lower interest
credit attributed to deposits in the declining rate environment
and was therefore not reflective of the solid growth in
customers and deposits.
Highlights of Retail Banking’s performance during 2008
include the following:
• Retail Banking expanded the number of customers it
serves and grew checking relationships. Total
checking relationships increased by a net 160,000
since December 31, 2007, which includes both the
conversion of Yardville and Sterling accounts as well
as the addition of new relationships through organic
growth. Excluding relationships added from
acquisitions, net new consumer and business
checking relationships grew by 72,000 in 2008
compared with 32,000 a year earlier.
• Average deposit balances increased $3.7 billion or
7% primarily as a result of strong money market
deposit growth and the benefits of the acquisitions.
• Our investment in online banking capabilities
continued to pay off. Since December 31, 2007, the
percentage of consumer checking households using
online bill payment increased from 33% to 41%. We
continue to seek customer growth by expanding our
use of technology, such as the recent launch of our
“Virtual Wallet” online banking product. Recently,
Virtual Wallet received a “Best of the Web” award
for 2008 from Online Banking Report.
• Retail Banking continued to invest in the branch
network. During 2008, we opened 19 new branches,
consolidated 45 branches, and acquired 65 branches
for a total of 1,148 branches at December 31, 2008.
We continue to work to optimize our network by
opening new branches in high growth areas,
relocating branches to areas of higher market
opportunity, and consolidating branches in areas of
declining opportunity. We relocated 8 branches
during 2008.
In October 2008 we announced an exclusive agreement under
which we will provide banking services in Giant Food LLC
supermarket locations across Virginia, Maryland, Delaware
and the District of Columbia. In 2009, we expect to open
approximately 40 new in-store branches and install
approximately 180 ATMs. Additional locations are expected
to open in subsequent years.
Total revenue for 2008 was $3.608 billion, a 1% increase
compared with $3.580 billion for 2007. Net interest income of
$1.992 billion decreased $70 million, or 3%, compared with
2007. This decline was primarily driven by a lower value
attributed to deposits in the declining rate environment
partially offset by benefits from earlier acquisitions.
Noninterest income increased $98 million, or 6%, compared
with 2007. This growth was attributed primarily to the
following:
• A gain of $95 million from the redemption of a
portion of our Visa Class B common shares related to
Visa’s March 2008 initial public offering,
• The Mercantile, Yardville and Sterling acquisitions,
• Increased volume-related consumer fees including
debit card, credit card, and merchant revenue, and
• Increased brokerage account activities.
These increases were partially offset by lower asset
management fees as a result of lower equity markets and by
other business gains in the prior year.
The Market Risk Management – Equity and Other Investment
Risk section of this Financial Review includes further
information regarding Visa.
The provision for credit losses for 2008 was $612 million
compared to $138 million for 2007. Net charge-offs were
$368 million for 2008 and $131 million in 2007. Asset quality
continued to migrate at an accelerated pace in the very
challenging economic and credit environment. The increases
in provision and net charge-offs were primarily a result of the
following:
• Downward credit migration of residential real estate
development and related sectors, commercial real
estate, and commercial and industrial loan portfolios,
and
• Increased levels of consumer and commercial charge-
offs given the current credit environment.
48