PNC Bank 2008 Annual Report Download - page 155
Download and view the complete annual report
Please find page 155 of the 2008 PNC Bank annual report below. You can navigate through the pages in the report by either clicking on the pages listed below, or by using the keyword search tool below to find specific information within the annual report.-
 1
1 -
2
-
3
-
4
-
5
-
6
-
7
-
8
-
9
-
10
-
11
-
12
-
13
-
14
-
15
-
16
-
17
-
18
-
19
-
20
-
21
-
22
-
23
-
24
-
25
-
26
-
27
-
28
-
29
-
30
-
31
-
32
-
33
-
34
-
35
-
36
-
37
-
38
-
39
-
40
-
41
-
42
-
43
-
44
-
45
-
46
-
47
-
48
-
49
-
50
-
51
-
52
-
53
-
54
-
55
-
56
-
57
-
58
-
59
-
60
-
61
-
62
-
63
-
64
-
65
-
66
-
67
-
68
-
69
-
70
-
71
-
72
-
73
-
74
-
75
-
76
-
77
-
78
-
79
-
80
-
81
-
82
-
83
-
84
-
85
-
86
-
87
-
88
-
89
-
90
-
91
-
92
-
93
-
94
-
95
-
96
-
97
-
98
-
99
-
100
-
101
-
102
-
103
-
104
-
105
-
106
-
107
-
108
-
109
-
110
-
111
-
112
-
113
-
114
-
115
-
116
-
117
-
118
-
119
-
120
-
121
-
122
-
123
-
124
-
125
-
126
-
127
-
128
-
129
-
130
-
131
-
132
-
133
-
134
-
135
-
136
-
137
-
138
-
139
-
140
-
141
-
142
-
143
-
144
-
 145
145 -
 146
146 -
 147
147 -
 148
148 -
 149
149 -
 150
150 -
 151
151 -
 152
152 -
 153
153 -
 154
154 -
 155
155 -
 156
156 -
 157
157 -
 158
158 -
 159
159 -
 160
160 -
 161
161 -
 162
162 -
 163
163 -
 164
164 -
 165
165 -
166
-
167
-
168
-
169
-
170
-
171
-
172
-
173
-
174
-
175
-
176
-
177
-
178
-
179
-
180
-
181
-
182
-
183
-
184
 |
 |

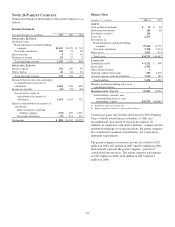
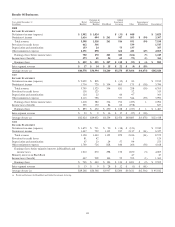
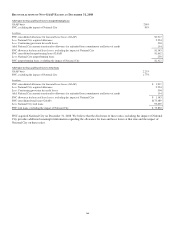
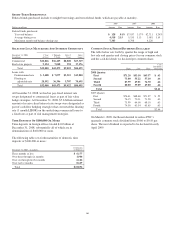
Statement Of Cash Flows
Year ended December 31 - in millions 2008 2007 2006
O
PERATING
A
CTIVITIES
Net income $ 882 $ 1,467 $ 2,595
Adjustments to reconcile net income
to net cash provided (used) by
operating activities:
Equity in undistributed net
(earnings) of subsidiaries 172 (443) (1,870)
Other 156 61 103
Net cash provided by operating
activities 1,210 1,085 828
I
NVESTING
A
CTIVITIES
Net capital returned from
(contributed to) subsidiaries (8,298) (165) 300
Investment securities:
Sales and maturities 1,090 3,440
Purchases (800) (3,437)
Net cash received from (paid for)
acquisitions 1,431 (2,231)
Other (104) (26) (311)
Net cash used in investing
activities (6,971) (2,132) (8)
F
INANCING
A
CTIVITIES
Borrowings from non-bank
subsidiary 2,100 3,910 210
Repayments on borrowings from
non-bank subsidiary (3,633) (1,432) (210)
Other short-term borrowed funds 103
Acquisition of treasury stock (234) (963) (531)
Cash dividends paid to shareholders (923) (806) (633)
TARP warrant 304
Treasury stock 375 253 343
Preferred stock-TARP 7,275
Preferred stock-other 492
Net cash provided by (used in)
financing activities 5,756 1,065 (821)
Increase (decrease) in cash and due
from banks (5) 18 (1)
Cash and due from banks at
beginning of year 20 23
Cash and due from banks at end
of year $15$20$ 2
N
OTE
27 S
EGMENT
R
EPORTING
We have four major businesses engaged in providing banking,
asset management and global investment servicing products
and services:
• Retail Banking,
• Corporate & Institutional Banking,
• BlackRock, and
• Global Investment Servicing
Results of individual businesses are presented based on our
management accounting practices and management structure.
There is no comprehensive, authoritative body of guidance for
management accounting equivalent to GAAP; therefore, the
financial results of our individual businesses are not
necessarily comparable with similar information for any other
company. We refine our methodologies from time to time as
our management accounting practices are enhanced and our
businesses and management structure change. Financial
results are presented, to the extent practicable, as if each
business operated on a stand-alone basis. As permitted under
GAAP, we have aggregated the business results for certain
similar operating segments for financial reporting purposes.
The business segment results in this Note 27 do not include
the impact of National City, which we acquired on
December 31, 2008.
Assets receive a funding charge and liabilities and capital
receive a funding credit based on a transfer pricing
methodology that incorporates product maturities, duration
and other factors. Capital is intended to cover unexpected
losses and is assigned to the banking and servicing businesses
using our risk-based economic capital model. We have
assigned to Retail Banking capital equal to 6% of funds to
reflect the capital required for well-capitalized domestic banks
and to approximate market comparables for this business. The
capital assigned for Global Investment Servicing reflects its
legal entity shareholder’s equity.
BlackRock business segment results for the first nine months
of 2006 reflected our majority ownership in BlackRock during
that period. Subsequent to the September 29, 2006 BlackRock/
MLIM transaction closing, which had the effect of reducing
our ownership interest at that time to approximately 34%, our
investment in BlackRock has been accounted for under the
equity method but continues to be a separate reportable
business segment of PNC. The fair value of our investment in
BlackRock at December 31, 2008 was approximately $5.8
billion. Our BlackRock business segment information for the
first nine months of 2006 included in this Note 27 was not
restated.
We have allocated the allowances for loan and lease losses
and unfunded loan commitments and letters of credit based on
our assessment of risk inherent in the business segment loan
portfolios. Our allocation of the costs incurred by operations
and other shared support areas not directly aligned with the
businesses is primarily based on the use of services.
Total business segment financial results differ from total
consolidated results. The impact of these differences is
reflected in the “Intercompany Eliminations” and “Other”
categories in the business segment tables. “Intercompany
Eliminations” reflects activities conducted among our
businesses that are eliminated in the consolidated results.
“Other” includes residual activities that do not meet the
criteria for disclosure as a separate reportable business, such
as gains or losses related to BlackRock transactions including
LTIP share distributions and obligations, earnings and gains or
losses related to Hilliard Lyons for 2008, integration costs,
asset and liability management activities including net
securities gains or losses and certain trading activities, equity
151