PNC Bank 2008 Annual Report Download - page 64
Download and view the complete annual report
Please find page 64 of the 2008 PNC Bank annual report below. You can navigate through the pages in the report by either clicking on the pages listed below, or by using the keyword search tool below to find specific information within the annual report.-
 1
1 -
2
-
3
-
4
-
5
-
6
-
7
-
8
-
9
-
10
-
11
-
12
-
13
-
14
-
15
-
16
-
17
-
18
-
19
-
20
-
21
-
22
-
23
-
24
-
25
-
26
-
27
-
28
-
29
-
30
-
31
-
32
-
33
-
34
-
35
-
36
-
37
-
38
-
39
-
40
-
41
-
42
-
43
-
44
-
45
-
46
-
47
-
48
-
49
-
50
-
51
-
52
-
53
-
 54
54 -
 55
55 -
 56
56 -
 57
57 -
 58
58 -
 59
59 -
 60
60 -
 61
61 -
 62
62 -
 63
63 -
 64
64 -
 65
65 -
 66
66 -
 67
67 -
 68
68 -
 69
69 -
 70
70 -
 71
71 -
 72
72 -
 73
73 -
 74
74 -
75
-
76
-
77
-
78
-
79
-
80
-
81
-
82
-
83
-
84
-
85
-
86
-
87
-
88
-
89
-
90
-
91
-
92
-
93
-
94
-
95
-
96
-
97
-
98
-
99
-
100
-
101
-
102
-
103
-
104
-
105
-
106
-
107
-
108
-
109
-
110
-
111
-
112
-
113
-
114
-
115
-
116
-
117
-
118
-
119
-
120
-
121
-
122
-
123
-
124
-
125
-
126
-
127
-
128
-
129
-
130
-
131
-
132
-
133
-
134
-
135
-
136
-
137
-
138
-
139
-
140
-
141
-
142
-
143
-
144
-
145
-
146
-
147
-
148
-
149
-
150
-
151
-
152
-
153
-
154
-
155
-
156
-
157
-
158
-
159
-
160
-
161
-
162
-
163
-
164
-
165
-
166
-
167
-
168
-
169
-
170
-
171
-
172
-
173
-
174
-
175
-
176
-
177
-
178
-
179
-
180
-
181
-
182
-
183
-
184
 |
 |

Policy area provides independent oversight to the
measurement, monitoring and reporting of our credit risk and
reports to the Chief Administrative Officer. Corporate Audit
also provides an independent assessment of the effectiveness
of the credit risk management process.
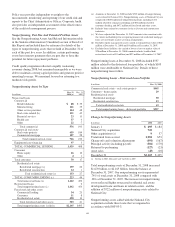
Nonperforming, Past Due And Potential Problem Assets
See the Nonperforming Assets And Related Information table
in the Statistical Information (Unaudited) section of Item 8 of
this Report and included here by reference for details of the
types of nonperforming assets that we held at December 31 of
each of the past five years. In addition, certain performing
assets have interest payments that are past due or have the
potential for future repayment problems.
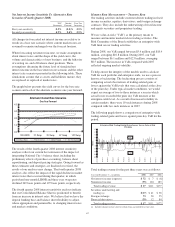
Credit quality migration reflected a rapidly weakening
economy during 2008, but remained manageable as we were
able to maintain a strong capital position and generate positive
operating leverage. We remained focused on returning to a
moderate risk profile.
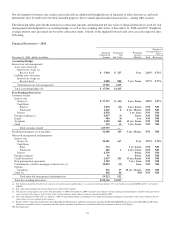
Nonperforming Assets by Type
In millions
Dec. 31
2008 (a)
Dec. 31
2007
Nonaccrual loans
Commercial
Retail/wholesale $88$39
Manufacturing 141 35
Other service providers 114 48
Real estate related (b) 151 45
Financial services 23 15
Health care 37 4
Other 22 7
Total commercial 576 193
Commercial real estate
Real estate projects 659 184
Commercial mortgage 107 28
Total commercial real estate 766 212
Equipment lease financing 97 3
TOTAL COMMERCIAL LENDING 1,439 408
Consumer
Home equity 66 16
Other 41
Total consumer 70 17
Residential real estate
Residential mortgage (c) 139 26
Residential construction 14 1
Total residential real estate (c) 153 27
TOTAL CONSUMER LENDING (c) 223 44
Total nonaccrual loans (c) 1,662 452
Restructured loans 2
Total nonperforming loans (c) 1,662 454
Foreclosed and other assets
Commercial lending 34 23
Consumer 11 8
Residential real estate 458 10
Total foreclosed and other assets 503 41
Total nonperforming assets (c)(d)(e) $2,165 $495
(a) Amounts at December 31, 2008 include $722 million of nonperforming
assets related to National City. Nonperforming assets of National City are
comprised of $250 million of nonperforming loans, including $154
million related to commercial lending and $96 million related to
consumer lending, and $472 million of foreclosed and other assets.
(b) Includes loans related to customers in the real estate and construction
industries.
(c) We have adjusted the December 31, 2007 amounts to be consistent with
the current methodology for recognizing nonaccrual residential mortgage
loans serviced under master servicing arrangements.
(d) Excludes equity management assets carried at estimated fair value of $42
million at December 31, 2008 and $4 million at December 31, 2007.
(e) Excludes loans held for sale carried at lower of cost or market value of
$78 million at December 31, 2008 (amount includes troubled debt
restructured assets of $5 million) and $25 million at December 31, 2007.
Nonperforming loans at December 31, 2008 included $537
million related to the distressed loan portfolio, of which $103
million were attributable to National City. Details of these
nonperforming loans follow.
Nonperforming Loans - Distressed Loan Portfolio
In millions Dec. 31, 2008
Commercial real estate – real estate projects $445
Consumer – home equity 29
Residential real estate
Residential mortgage 50
Residential construction 13
Total residential real estate 63
Total nonperforming loans – distressed portfolio $537
Change In Nonperforming Assets
In millions 2008 2007
January 1 $ 495 $ 184
National City acquisition 722
Other acquisitions (a) 937
Transferred from accrual 1,981 653
Charge-offs and valuation adjustments (491) (167)
Principal activity including payoffs (381) (179)
Returned to performing (127) (23)
Asset sales (43) (10)
December 31 $2,165 $ 495
(a) Sterling in 2008; Mercantile and Yardville in 2007.
Total nonperforming assets at December 31, 2008 increased
$1.670 billion, to $2.165 billion, from the balance at
December 31, 2007. Our nonperforming assets represented
.74% of total assets at December 31, 2008 compared with
.36% at December 31, 2007. The increase in nonperforming
assets reflected higher nonaccrual residential real estate
development loans and loans in related sectors, and the
addition of $722 million of nonperforming assets related to
National City.
Nonperforming assets added with the National City
acquisition exclude those loans that we impaired in
accordance with SOP 03-3.
60