PNC Bank 2008 Annual Report Download - page 32
Download and view the complete annual report
Please find page 32 of the 2008 PNC Bank annual report below. You can navigate through the pages in the report by either clicking on the pages listed below, or by using the keyword search tool below to find specific information within the annual report.-
 1
1 -
2
-
3
-
4
-
5
-
6
-
7
-
8
-
9
-
10
-
11
-
12
-
13
-
14
-
15
-
16
-
17
-
18
-
19
-
20
-
21
-
 22
22 -
 23
23 -
 24
24 -
 25
25 -
 26
26 -
 27
27 -
 28
28 -
 29
29 -
 30
30 -
 31
31 -
 32
32 -
 33
33 -
 34
34 -
 35
35 -
 36
36 -
 37
37 -
 38
38 -
 39
39 -
 40
40 -
 41
41 -
 42
42 -
43
-
44
-
45
-
46
-
47
-
48
-
49
-
50
-
51
-
52
-
53
-
54
-
55
-
56
-
57
-
58
-
59
-
60
-
61
-
62
-
63
-
64
-
65
-
66
-
67
-
68
-
69
-
70
-
71
-
72
-
73
-
74
-
75
-
76
-
77
-
78
-
79
-
80
-
81
-
82
-
83
-
84
-
85
-
86
-
87
-
88
-
89
-
90
-
91
-
92
-
93
-
94
-
95
-
96
-
97
-
98
-
99
-
100
-
101
-
102
-
103
-
104
-
105
-
106
-
107
-
108
-
109
-
110
-
111
-
112
-
113
-
114
-
115
-
116
-
117
-
118
-
119
-
120
-
121
-
122
-
123
-
124
-
125
-
126
-
127
-
128
-
129
-
130
-
131
-
132
-
133
-
134
-
135
-
136
-
137
-
138
-
139
-
140
-
141
-
142
-
143
-
144
-
145
-
146
-
147
-
148
-
149
-
150
-
151
-
152
-
153
-
154
-
155
-
156
-
157
-
158
-
159
-
160
-
161
-
162
-
163
-
164
-
165
-
166
-
167
-
168
-
169
-
170
-
171
-
172
-
173
-
174
-
175
-
176
-
177
-
178
-
179
-
180
-
181
-
182
-
183
-
184
 |
 |

C
ONSOLIDATED
I
NCOME
S
TATEMENT
R
EVIEW
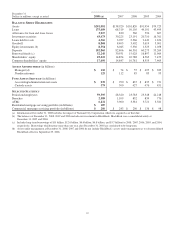
Our Consolidated Income Statement is presented in Item 8 of
this Report. Net income for 2008 was $882 million and for
2007 was $1.467 billion. Total revenue for 2008 increased 7%
compared with 2007. We created positive operating leverage
in the year-to-date comparison as total noninterest expense
increased 3% in the comparison.
N
ET
I
NTEREST
I
NCOME AND
N
ET
I
NTEREST
M
ARGIN
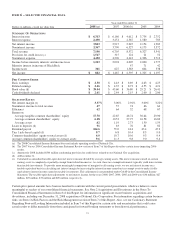
Year ended December 31
Dollars in millions 2008 2007
Net interest income $3,823 $2,915
Net interest margin 3.37% 3.00%
Changes in net interest income and margin result from the
interaction of the volume and composition of interest-earning
assets and related yields, interest-bearing liabilities and related
rates paid, and noninterest-bearing sources of funding. See
Statistical Information – Analysis Of Year-To-Year Changes
In Net Interest (Unaudited) Income And Average
Consolidated Balance Sheet and Net Interest Analysis in
Item 8 of this Report for additional information.
The 31% increase in net interest income for 2008 compared
with 2007 was favorably impacted by the $16.5 billion, or
17%, increase in average interest-earning assets and a
decrease in funding costs. The 2008 net interest margin was
positively affected by declining rates paid on deposits and
borrowings compared with the prior year. The reasons driving
the higher interest-earning assets in these comparisons are
further discussed in the Balance Sheet Highlights portion of
the Executive Summary section of this Item 7.
The net interest margin was 3.37% for 2008 and 3.00% for
2007. The following factors impacted the comparison:
• A decrease in the rate paid on interest-bearing
liabilities of 140 basis points. The rate paid on
interest-bearing deposits, the single largest
component, decreased 123 basis points.
• These factors were partially offset by a 77 basis point
decrease in the yield on interest-earning assets. The
yield on loans, the single largest component,
decreased 109 basis points.
• In addition, the impact of noninterest-bearing sources
of funding decreased 26 basis points due to lower
interest rates and a lower proportion of noninterest-
bearing sources of funding to interest-earning assets.
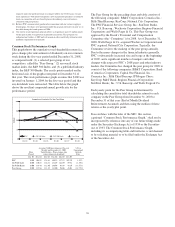
For comparing to the broader market, during 2008 the average
federal funds rate was 1.94% compared with 5.03% for 2007.
We expect our full-year 2009 net interest income to benefit
from the impact of interest accretion of discounts resulting
from purchase accounting marks and deposit pricing
alignment related to our National City acquisition. We also
currently expect our 2009 net interest margin to improve on a
year-over-year basis.
N
ONINTEREST
I
NCOME
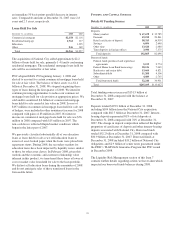
Summary
Noninterest income was $3.367 billion for 2008 and $3.790
billion for 2007.
Noninterest income for 2008 included the following:
• Gains of $246 million related to the mark-to-market
adjustment on our BlackRock LTIP shares
obligation,
• Losses related to our commercial mortgage loans
held for sale of $197 million, net of hedges,
• Impairment and other losses related to alternative
investments of $179 million,
• Income from Hilliard Lyons totaling $164 million,
including the first quarter gain of $114 million from
the sale of this business,
• Net securities losses of $206 million,
• A first quarter gain of $95 million related to the
redemption of a portion of our Visa Class B common
shares related to Visa’s March 2008 initial public
offering,
• A third quarter $61 million reversal of a legal
contingency reserve established in connection with
an acquisition due to a settlement,
• Trading losses of $55 million,
• A $35 million impairment charge on commercial
mortgage servicing rights, and
• Equity management losses of $24 million.
Noninterest income for 2007 included the following:
• The impact of $82 million gain recognized in
connection with our transfer of BlackRock shares to
satisfy a portion of PNC’s LTIP obligation and a
$209 million net loss on our LTIP shares obligation,
• Income from Hilliard Lyons totaling $227 million,
• Trading income of $104 million,
• Equity management gains of $102 million, and
• Gains related to our commercial mortgage loans held
for sale of $3 million, net of hedges.
Apart from the impact of these items, noninterest income
increased $16 million in 2008 compared with 2007.
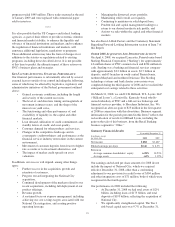
Additional analysis
Fund servicing fees increased $69 million in 2008, to $904
million, compared with $835 million in 2007. The impact of
the December 2007 acquisition of Albridge Solutions Inc.
(“Albridge Solutions”) and growth in Global Investment
Servicing’s offshore operations were the primary drivers of
this increase.
Global Investment Servicing provided fund accounting/
administration services for $839 billion of net fund investment
assets and provided custody services for $379 billion of fund
28