PNC Bank 2008 Annual Report Download - page 108
Download and view the complete annual report
Please find page 108 of the 2008 PNC Bank annual report below. You can navigate through the pages in the report by either clicking on the pages listed below, or by using the keyword search tool below to find specific information within the annual report.-
 1
1 -
2
-
3
-
4
-
5
-
6
-
7
-
8
-
9
-
10
-
11
-
12
-
13
-
14
-
15
-
16
-
17
-
18
-
19
-
20
-
21
-
22
-
23
-
24
-
25
-
26
-
27
-
28
-
29
-
30
-
31
-
32
-
33
-
34
-
35
-
36
-
37
-
38
-
39
-
40
-
41
-
42
-
43
-
44
-
45
-
46
-
47
-
48
-
49
-
50
-
51
-
52
-
53
-
54
-
55
-
56
-
57
-
58
-
59
-
60
-
61
-
62
-
63
-
64
-
65
-
66
-
67
-
68
-
69
-
70
-
71
-
72
-
73
-
74
-
75
-
76
-
77
-
78
-
79
-
80
-
81
-
82
-
83
-
84
-
85
-
86
-
87
-
88
-
89
-
90
-
91
-
92
-
93
-
94
-
95
-
96
-
97
-
 98
98 -
 99
99 -
 100
100 -
 101
101 -
 102
102 -
 103
103 -
 104
104 -
 105
105 -
 106
106 -
 107
107 -
 108
108 -
 109
109 -
 110
110 -
 111
111 -
 112
112 -
 113
113 -
 114
114 -
 115
115 -
 116
116 -
 117
117 -
 118
118 -
119
-
120
-
121
-
122
-
123
-
124
-
125
-
126
-
127
-
128
-
129
-
130
-
131
-
132
-
133
-
134
-
135
-
136
-
137
-
138
-
139
-
140
-
141
-
142
-
143
-
144
-
145
-
146
-
147
-
148
-
149
-
150
-
151
-
152
-
153
-
154
-
155
-
156
-
157
-
158
-
159
-
160
-
161
-
162
-
163
-
164
-
165
-
166
-
167
-
168
-
169
-
170
-
171
-
172
-
173
-
174
-
175
-
176
-
177
-
178
-
179
-
180
-
181
-
182
-
183
-
184
 |
 |

PNC REIT Corp., PNC has committed to purchase such
in-kind dividend from the applicable PNC REIT Corp. holders
in exchange for a cash payment representing the market value
of such in-kind dividend, and PNC has committed to
contribute such in-kind dividend to PNC Bank, N.A.
N
OTE
4L
OANS
,C
OMMITMENTS TO
E
XTEND
C
REDIT AND
C
ONCENTRATIONS OF
C
REDIT
R
ISK
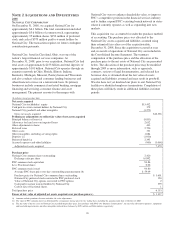
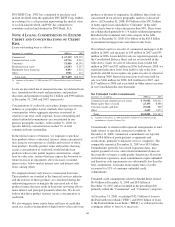
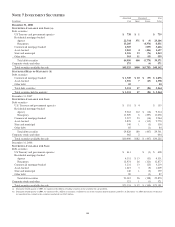
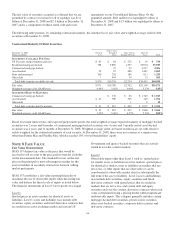
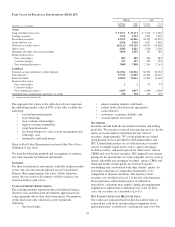
Loans outstanding were as follows:
December 31 - in millions 2008 (a) 2007
Commercial $ 67,319 $28,539
Commercial real estate 25,736 8,903
Consumer 52,489 18,393
Residential real estate 21,583 9,557
Equipment lease financing 6,461 2,514
Other 1,901 413
Total loans $175,489 $68,319
(a) Amounts at December 31, 2008 include $99.7 billion of loans related to National
City.
Loans are presented net of unearned income, net deferred loan
fees, unamortized discounts and premiums, and purchase
discounts and premiums totaling $4.1 billion and $990 million
at December 31, 2008 and 2007, respectively.
Concentrations of credit risk exist when changes in economic,
industry or geographic factors similarly affect groups of
counterparties whose aggregate exposure is material in
relation to our total credit exposure. Loans outstanding and
related unfunded commitments are concentrated in our
primary geographic markets. At December 31, 2008, no
specific industry concentration exceeded 7% of total
commercial loans outstanding.
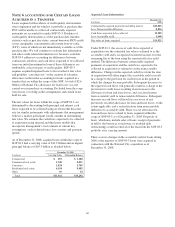
In the normal course of business, we originate or purchase
loan products whose contractual features, when concentrated,
may increase our exposure as a holder and servicer of those
loan products. Possible product terms and features that may
create a concentration of credit risk would include loan
products whose terms permit negative amortization, a high
loan-to-value ratio, features that may expose the borrower to
future increases in repayments above increases in market
interest rates, below-market interest rates and interest-only
loans, among others.
We originate interest-only loans to commercial borrowers.
These products are standard in the financial services industry
and the features of these products are considered during the
underwriting process to mitigate the increased risk of this
product feature that may result in borrowers not being able to
make interest and principal payments when due. We do not
believe that these product features create a concentration of
credit risk.
We also originate home equity loans and lines of credit that
result in a credit concentration of high loan-to-value ratio loan
products at the time of origination. In addition, these loans are
concentrated in our primary geographic markets as discussed
above. At December 31, 2008, $6.8 billion of the $38.3 billion
of home equity loans (included in “Consumer” in the table
above) had a loan-to-value ratio greater than 90%. These loans
are collateralized primarily by 1-4 family residential properties.
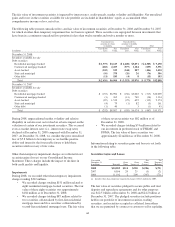
Included in the residential real estate category in the table
above, at December 31, 2008, $5.6 billion of the $18.8 billion
of residential mortgage loans were interest-only loans.
We realized a net loss on sales of commercial mortgages of $6
million in 2008, and net gains of $39 million in 2007 and $55
million in 2006. Loans held for sale are reported separately on
the Consolidated Balance Sheet and are not included in the
table above. Gains on sales of education loans totaled $24
million in 2007 and $33 million in 2006. In February 2008, we
transferred education loans from held for sale to the loan
portfolio and did not recognize any gains on sales of education
loans during 2008. Interest income from total loans held for
sale was $166 million for 2008, $184 million for 2007, and
$157 million for 2006 and is included in Other interest income
in our Consolidated Income Statement.
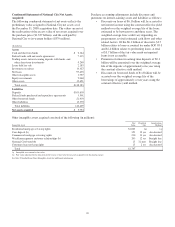
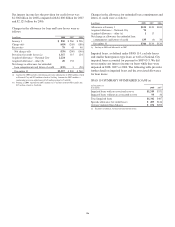
Net Unfunded Credit Commitments
December 31 - in millions 2008 (a) 2007
Commercial and commercial real estate $ 59,982 $42,021
Home equity lines of credit 23,195 8,680
Consumer credit card lines 19,028 969
Other 2,683 1,677
Total $104,888 $53,347
(a) Amounts at December 31, 2008 include $53.9 billion of net unfunded credit
commitments related to National City.
Commitments to extend credit represent arrangements to lend
funds subject to specified contractual conditions. At
December 31, 2008, commercial commitments are reported
net of $8.6 billion of participations, assignments and
syndications, primarily to financial services companies. The
comparable amount at December 31, 2007 was $8.9 billion.
Commitments generally have fixed expiration dates, may
require payment of a fee, and contain termination clauses in
the event the customer’s credit quality deteriorates. Based on
our historical experience, most commitments expire unfunded,
and therefore cash requirements are substantially less than the
total commitment. Consumer home equity lines of credit
accounted for 55% of consumer unfunded credit
commitments.
Unfunded credit commitments related to Market Street totaled
$6.4 billion at December 31, 2008 and $8.8 billion at
December 31, 2007 and are included in the preceding table
primarily within the “Commercial” and “Consumer” categories.
At December 31, 2008, we pledged $32.9 billion of loans to
the Federal Reserve Bank (“FRB”) and $50.0 billion of loans
to the Federal Home Loan Bank (“FHLB”) as collateral for the
contingent ability to borrow, if necessary.
104