PNC Bank 2008 Annual Report Download - page 46
Download and view the complete annual report
Please find page 46 of the 2008 PNC Bank annual report below. You can navigate through the pages in the report by either clicking on the pages listed below, or by using the keyword search tool below to find specific information within the annual report.-
 1
1 -
2
-
3
-
4
-
5
-
6
-
7
-
8
-
9
-
10
-
11
-
12
-
13
-
14
-
15
-
16
-
17
-
18
-
19
-
20
-
21
-
22
-
23
-
24
-
25
-
26
-
27
-
28
-
29
-
30
-
31
-
32
-
33
-
34
-
35
-
 36
36 -
 37
37 -
 38
38 -
 39
39 -
 40
40 -
 41
41 -
 42
42 -
 43
43 -
 44
44 -
 45
45 -
 46
46 -
 47
47 -
 48
48 -
 49
49 -
 50
50 -
 51
51 -
 52
52 -
 53
53 -
 54
54 -
 55
55 -
 56
56 -
57
-
58
-
59
-
60
-
61
-
62
-
63
-
64
-
65
-
66
-
67
-
68
-
69
-
70
-
71
-
72
-
73
-
74
-
75
-
76
-
77
-
78
-
79
-
80
-
81
-
82
-
83
-
84
-
85
-
86
-
87
-
88
-
89
-
90
-
91
-
92
-
93
-
94
-
95
-
96
-
97
-
98
-
99
-
100
-
101
-
102
-
103
-
104
-
105
-
106
-
107
-
108
-
109
-
110
-
111
-
112
-
113
-
114
-
115
-
116
-
117
-
118
-
119
-
120
-
121
-
122
-
123
-
124
-
125
-
126
-
127
-
128
-
129
-
130
-
131
-
132
-
133
-
134
-
135
-
136
-
137
-
138
-
139
-
140
-
141
-
142
-
143
-
144
-
145
-
146
-
147
-
148
-
149
-
150
-
151
-
152
-
153
-
154
-
155
-
156
-
157
-
158
-
159
-
160
-
161
-
162
-
163
-
164
-
165
-
166
-
167
-
168
-
169
-
170
-
171
-
172
-
173
-
174
-
175
-
176
-
177
-
178
-
179
-
180
-
181
-
182
-
183
-
184
 |
 |

obligations, PNC would be subject during the period of such
default or deferral to restrictions on dividends and other
provisions protecting the status of the debenture holders
similar to or in some ways more restrictive than those
potentially imposed under the Exchange Agreements with
Trust II and Trust III, as described above.
We are subject to replacement capital covenants (“RCCs”)
with respect to four tranches of junior subordinated debentures
inherited from National City, copies of which RCCs were
attached, respectively, as Exhibit 99.2 to the National City
Form 8-K filed on February 4, 2008 and Exhibit 99.1 to the
National City Forms 8-K filed on November 9, 2006, May 25,
2007 and August 30, 2007. See Note 14 Capital Securities of
Subsidiary Trusts. Similarly, we are subject to a replacement
capital covenant with respect to our Series L Preferred Stock,
a copy of which was attached as Exhibit 99.1 to National
City’s Form 8-K filed on February 4, 2008. See Note 19
Shareholders’ Equity in Item 8 of this Report.
F
AIR
V
ALUE
M
EASUREMENTS AND
F
AIR
V
ALUE
O
PTION
We adopted SFAS 157, “Fair Value Measurements” (“SFAS
157”), and SFAS 159, “The Fair Value Option for Financial
Assets and Financial Liabilities – Including an amendment of
FASB Statement No. 115” (“SFAS 159”), on January 1, 2008.
SFAS 157 defines fair value, establishes a framework for
measuring fair value, and expands disclosures about fair value
measurements. SFAS 159 permits entities to choose to
measure many financial instruments and certain other items at
fair value. Under SFAS 159, we elected to fair value certain
commercial mortgage loans classified as held for sale and
certain customer resale agreements and bank notes to align the
accounting for the changes in the fair value of these financial
instruments with the changes in the value of their related
hedges. See Note 8 Fair Value in the Notes To Consolidated
Financial Statements under Item 8 of this Report for further
information.
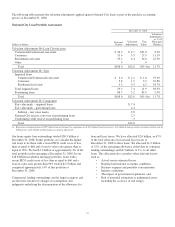
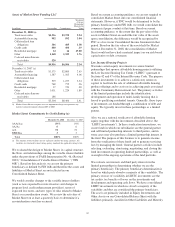
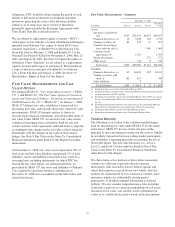
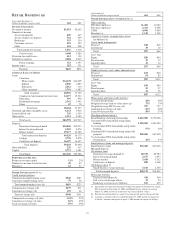
At December 31, 2008, fair value assets represented 13% of
total assets and fair value liabilities represented 2% of total
liabilities. Assets and liabilities measured at fair value on a
recurring basis, including instruments for which PNC has
elected the fair value option, are summarized below. As
prescribed by SFAS 157, the assets and liabilities of National
City acquired in a purchase business combination on
December 31, 2008 were excluded from the table below and
related disclosures.
Fair Value Measurements – Summary
In millions
December 31, 2008
Level 1 Level 2 Level 3
Total Fair
Value
Assets
Securities available for
sale $347 $21,633 $4,837 $26,817
Financial derivatives (a) 16 5,582 125 5,723
Trading securities (b) 89 529 73 691
Commercial mortgage
loans held for sale (c) 1,400 1,400
Customer resale
agreements (d) 1,072 1,072
Equity investments 571 571
Other assets 144 6 150
Total assets $452 $28,960 $7,012 $36,424
Liabilities
Financial derivatives (e) $2 $4,387 $22 $4,411
Trading securities sold
short (f) 182 207 389
Other liabilities 9 9
Total liabilities $184 $ 4,603 $ 22 $ 4,809
(a) Included in other assets on the Consolidated Balance Sheet.
(b) Included in trading securities on the Consolidated Balance Sheet. Fair value includes
net unrealized losses of $27.5 million.
(c) Included in loans held for sale on the Consolidated Balance Sheet. PNC has elected
the fair value option under SFAS 159 for certain commercial mortgage loans held
for sale.
(d) Included in federal funds sold and resale agreements on the Consolidated Balance
Sheet. PNC has elected the fair value option under SFAS 159 for this item.
(e) Included in other liabilities on the Consolidated Balance Sheet.
(f) Included in other borrowed funds on the Consolidated Balance Sheet.
Valuation Hierarchy
The following is an outline of the valuation methodologies
used for measuring fair value under SFAS 157 for the major
items above. SFAS 157 focuses on the exit price in the
principal or most advantageous market for the asset or liability
in an orderly transaction between willing market participants
and establishes a reporting hierarchy to maximize the use of
observable inputs. The fair value hierarchy (i.e., Level 1,
Level 2, and Level 3) is described in detail in Note 8 Fair
Value in the Notes To Consolidated Financial Statements
under Item 8 of this Report.
We characterize active markets as those where transaction
volumes are sufficient to provide objective pricing
information, with reasonably narrow bid/ask spreads and
where dealer quotes received do not vary widely. Inactive
markets are characterized by low transaction volumes, price
quotations which vary substantially among market
participants, or in which minimal information is released
publicly. We also consider nonperformance risks including
credit risk as part of our valuation methodology for all assets
measured at fair value. Any models used to determine fair
values or to validate dealer quotes based on the descriptions
42