PNC Bank 2008 Annual Report Download - page 86
Download and view the complete annual report
Please find page 86 of the 2008 PNC Bank annual report below. You can navigate through the pages in the report by either clicking on the pages listed below, or by using the keyword search tool below to find specific information within the annual report.-
 1
1 -
2
-
3
-
4
-
5
-
6
-
7
-
8
-
9
-
10
-
11
-
12
-
13
-
14
-
15
-
16
-
17
-
18
-
19
-
20
-
21
-
22
-
23
-
24
-
25
-
26
-
27
-
28
-
29
-
30
-
31
-
32
-
33
-
34
-
35
-
36
-
37
-
38
-
39
-
40
-
41
-
42
-
43
-
44
-
45
-
46
-
47
-
48
-
49
-
50
-
51
-
52
-
53
-
54
-
55
-
56
-
57
-
58
-
59
-
60
-
61
-
62
-
63
-
64
-
65
-
66
-
67
-
68
-
69
-
70
-
71
-
72
-
73
-
74
-
75
-
 76
76 -
 77
77 -
 78
78 -
 79
79 -
 80
80 -
 81
81 -
 82
82 -
 83
83 -
 84
84 -
 85
85 -
 86
86 -
 87
87 -
 88
88 -
 89
89 -
 90
90 -
 91
91 -
 92
92 -
 93
93 -
 94
94 -
 95
95 -
 96
96 -
97
-
98
-
99
-
100
-
101
-
102
-
103
-
104
-
105
-
106
-
107
-
108
-
109
-
110
-
111
-
112
-
113
-
114
-
115
-
116
-
117
-
118
-
119
-
120
-
121
-
122
-
123
-
124
-
125
-
126
-
127
-
128
-
129
-
130
-
131
-
132
-
133
-
134
-
135
-
136
-
137
-
138
-
139
-
140
-
141
-
142
-
143
-
144
-
145
-
146
-
147
-
148
-
149
-
150
-
151
-
152
-
153
-
154
-
155
-
156
-
157
-
158
-
159
-
160
-
161
-
162
-
163
-
164
-
165
-
166
-
167
-
168
-
169
-
170
-
171
-
172
-
173
-
174
-
175
-
176
-
177
-
178
-
179
-
180
-
181
-
182
-
183
-
184
 |
 |

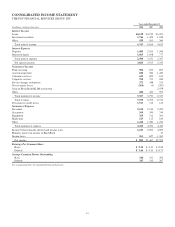
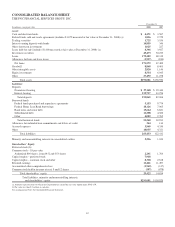
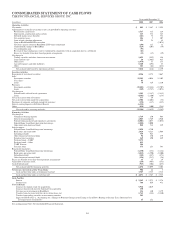
CONSOLIDATED BALANCE SHEET
THE PNC FINANCIAL SERVICES GROUP, INC.
December 31
In millions, except par value 2008 2007
Assets
Cash and due from banks $ 4,471 $ 3,567
Federal funds sold and resale agreements (includes $1,072 measured at fair value at December 31, 2008) (a) 1,856 2,729
Trading securities 1,725 3,556
Interest-earning deposits with banks 14,859 346
Other short-term investments 1,025 227
Loans held for sale (includes $1,400 measured at fair value at December 31, 2008) (a) 4,366 3,927
Investment securities 43,473 30,225
Loans 175,489 68,319
Allowance for loan and lease losses (3,917) (830)
Net loans 171,572 67,489
Goodwill 8,868 8,405
Other intangible assets 2,820 1,146
Equity investments 8,554 6,045
Other 27,492 11,258
Total assets $291,081 $138,920
Liabilities
Deposits
Noninterest-bearing $ 37,148 $ 19,440
Interest-bearing 155,717 63,256
Total deposits 192,865 82,696
Borrowed funds
Federal funds purchased and repurchase agreements 5,153 9,774
Federal Home Loan Bank borrowings 18,126 7,065
Bank notes and senior debt 13,664 6,821
Subordinated debt 11,208 4,506
Other 4,089 2,765
Total borrowed funds 52,240 30,931
Allowance for unfunded loan commitments and letters of credit 344 134
Accrued expenses 3,949 4,330
Other 14,035 4,321
Total liabilities 263,433 122,412
Minority and noncontrolling interests in consolidated entities 2,226 1,654
Shareholders’ Equity
Preferred stock (b)
Common stock – $5 par value
Authorized 800 shares, issued 452 and 353 shares 2,261 1,764
Capital surplus – preferred stock 7,918
Capital surplus – common stock and other 8,328 2,618
Retained earnings 11,461 11,497
Accumulated other comprehensive loss (3,949) (147)
Common stock held in treasury at cost: 9 and 12 shares (597) (878)
Total shareholders’ equity 25,422 14,854
Total liabilities, minority and noncontrolling interests,
and shareholders’ equity $291,081 $138,920
(a) Amounts represent items for which the Corporation has elected the fair value option under SFAS 159.
(b) Par value less than $.5 million at each date.
See accompanying Notes To Consolidated Financial Statements.
82