PNC Bank 2008 Annual Report Download - page 85
Download and view the complete annual report
Please find page 85 of the 2008 PNC Bank annual report below. You can navigate through the pages in the report by either clicking on the pages listed below, or by using the keyword search tool below to find specific information within the annual report.-
 1
1 -
2
-
3
-
4
-
5
-
6
-
7
-
8
-
9
-
10
-
11
-
12
-
13
-
14
-
15
-
16
-
17
-
18
-
19
-
20
-
21
-
22
-
23
-
24
-
25
-
26
-
27
-
28
-
29
-
30
-
31
-
32
-
33
-
34
-
35
-
36
-
37
-
38
-
39
-
40
-
41
-
42
-
43
-
44
-
45
-
46
-
47
-
48
-
49
-
50
-
51
-
52
-
53
-
54
-
55
-
56
-
57
-
58
-
59
-
60
-
61
-
62
-
63
-
64
-
65
-
66
-
67
-
68
-
69
-
70
-
71
-
72
-
73
-
74
-
 75
75 -
 76
76 -
 77
77 -
 78
78 -
 79
79 -
 80
80 -
 81
81 -
 82
82 -
 83
83 -
 84
84 -
 85
85 -
 86
86 -
 87
87 -
 88
88 -
 89
89 -
 90
90 -
 91
91 -
 92
92 -
 93
93 -
 94
94 -
 95
95 -
96
-
97
-
98
-
99
-
100
-
101
-
102
-
103
-
104
-
105
-
106
-
107
-
108
-
109
-
110
-
111
-
112
-
113
-
114
-
115
-
116
-
117
-
118
-
119
-
120
-
121
-
122
-
123
-
124
-
125
-
126
-
127
-
128
-
129
-
130
-
131
-
132
-
133
-
134
-
135
-
136
-
137
-
138
-
139
-
140
-
141
-
142
-
143
-
144
-
145
-
146
-
147
-
148
-
149
-
150
-
151
-
152
-
153
-
154
-
155
-
156
-
157
-
158
-
159
-
160
-
161
-
162
-
163
-
164
-
165
-
166
-
167
-
168
-
169
-
170
-
171
-
172
-
173
-
174
-
175
-
176
-
177
-
178
-
179
-
180
-
181
-
182
-
183
-
184
 |
 |

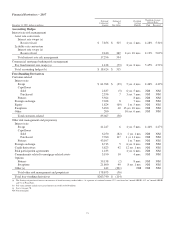
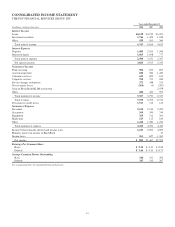
CONSOLIDATED INCOME STATEMENT
THE PNC FINANCIAL SERVICES GROUP, INC.
Year ended December 31
In millions, except per share data 2008 2007 2006
Interest Income
Loans $4,138 $4,232 $3,203
Investment securities 1,746 1,429 1,049
Other 429 505 360
Total interest income 6,313 6,166 4,612
Interest Expense
Deposits 1,485 2,053 1,590
Borrowed funds 1,005 1,198 777
Total interest expense 2,490 3,251 2,367
Net interest income 3,823 2,915 2,245
Noninterest Income
Fund servicing 904 835 893
Asset management 686 784 1,420
Consumer services 623 692 611
Corporate services 704 713 626
Service charges on deposits 372 348 313
Net securities losses (206) (5) (207)
Gain on BlackRock/MLIM transaction 2,078
Other 284 423 593
Total noninterest income 3,367 3,790 6,327
Total revenue 7,190 6,705 8,572
Provision for credit losses 1,517 315 124
Noninterest Expense
Personnel 2,154 2,140 2,432
Occupancy 368 350 310
Equipment 359 311 303
Marketing 125 115 104
Other 1,424 1,380 1,294
Total noninterest expense 4,430 4,296 4,443
Income before minority interest and income taxes 1,243 2,094 4,005
Minority interest in income of BlackRock 47
Income taxes 361 627 1,363
Net income $ 882 $1,467 $2,595
Earnings Per Common Share
Basic $ 2.50 $ 4.43 $ 8.89
Diluted $ 2.46 $ 4.35 $ 8.73
Average Common Shares Outstanding
Basic 344 331 292
Diluted 347 335 297
See accompanying Notes To Consolidated Financial Statements.
81