PNC Bank 2008 Annual Report Download - page 33
Download and view the complete annual report
Please find page 33 of the 2008 PNC Bank annual report below. You can navigate through the pages in the report by either clicking on the pages listed below, or by using the keyword search tool below to find specific information within the annual report.-
 1
1 -
2
-
3
-
4
-
5
-
6
-
7
-
8
-
9
-
10
-
11
-
12
-
13
-
14
-
15
-
16
-
17
-
18
-
19
-
20
-
21
-
22
-
 23
23 -
 24
24 -
 25
25 -
 26
26 -
 27
27 -
 28
28 -
 29
29 -
 30
30 -
 31
31 -
 32
32 -
 33
33 -
 34
34 -
 35
35 -
 36
36 -
 37
37 -
 38
38 -
 39
39 -
 40
40 -
 41
41 -
 42
42 -
 43
43 -
44
-
45
-
46
-
47
-
48
-
49
-
50
-
51
-
52
-
53
-
54
-
55
-
56
-
57
-
58
-
59
-
60
-
61
-
62
-
63
-
64
-
65
-
66
-
67
-
68
-
69
-
70
-
71
-
72
-
73
-
74
-
75
-
76
-
77
-
78
-
79
-
80
-
81
-
82
-
83
-
84
-
85
-
86
-
87
-
88
-
89
-
90
-
91
-
92
-
93
-
94
-
95
-
96
-
97
-
98
-
99
-
100
-
101
-
102
-
103
-
104
-
105
-
106
-
107
-
108
-
109
-
110
-
111
-
112
-
113
-
114
-
115
-
116
-
117
-
118
-
119
-
120
-
121
-
122
-
123
-
124
-
125
-
126
-
127
-
128
-
129
-
130
-
131
-
132
-
133
-
134
-
135
-
136
-
137
-
138
-
139
-
140
-
141
-
142
-
143
-
144
-
145
-
146
-
147
-
148
-
149
-
150
-
151
-
152
-
153
-
154
-
155
-
156
-
157
-
158
-
159
-
160
-
161
-
162
-
163
-
164
-
165
-
166
-
167
-
168
-
169
-
170
-
171
-
172
-
173
-
174
-
175
-
176
-
177
-
178
-
179
-
180
-
181
-
182
-
183
-
184
 |
 |
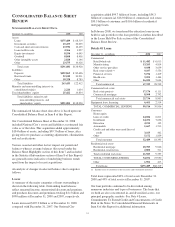
investment assets at December 31, 2008, compared with $990
billion and $500 billion, respectively, at December 31, 2007.
The decrease in assets serviced was due to declines in asset
values and fund outflows resulting primarily from market
conditions in the second half of 2008.
Asset management fees totaled $686 million in 2008, a
decline of $98 million compared with 2007. The effect on fees
of lower equity earnings from BlackRock, a $12 billion
decrease in assets managed due to equity values related to
wealth management, and the Hilliard Lyons divestiture were
reflected in the decline compared with 2007. Excluding $53
billion of assets acquired on December 31, 2008 resulting
from our acquisition of National City, assets managed at
December 31, 2008 totaled $57 billion compared with $74
billion at December 31, 2007. The Hilliard Lyons sale and the
impact of comparatively lower equity markets in 2008 drove
the decline in assets managed. The Retail Banking section of
the Business Segments Review section of this Item 7 includes
further discussion of assets under management.
Consumer services fees declined $69 million, to $623 million,
for 2008 compared with 2007. The sale of Hilliard Lyons
more than offset the benefits of increased volume-related fees,
including debit card, credit card, bank brokerage and merchant
revenues.
Corporate services revenue totaled $704 million in 2008
compared with $713 million in 2007. Higher revenue from
treasury management and other fees were more than offset by
lower merger and acquisition advisory fees and commercial
mortgage servicing fees, net of amortization.
Service charges on deposits grew $24 million, to $372 million,
in 2008 compared with 2007. The impact of our expansion
into new markets contributed to the increase during 2008.
Net securities losses totaled $206 million in 2008 compared
with net securities losses of $5 million in 2007. Losses for
2008 included other-than-temporary impairment charges of
$312 million, including $74 million on our investment in
preferred stock of FHLMC and FNMA that were partially
offset by securities gains.
Other noninterest income totaled $284 million for 2008
compared with $423 million for 2007. Other noninterest
income for 2008 included gains of $246 million related to our
BlackRock LTIP shares adjustment, the $114 million gain
from the sale of Hilliard Lyons, the $95 million gain from the
redemption of a portion of our investment in Visa related to its
March 2008 initial public offering, and the $61 million
reversal of a legal contingency reserve referred to above. The
impact of these items was partially offset by losses related to
our commercial mortgage loans held for sale of $197 million,
net of hedges, trading losses of $55 million and equity
management losses of $24 million.
Other noninterest income for 2007 included a net loss related
to our BlackRock investment of $127 million (the net of the
two items described within the Summary section above),
trading income of $104 million, equity management gains of
$102 million and gains related to our commercial mortgage
loans held for sale, net of hedges, of $3 million.
See the BlackRock portion of the Business Segments Review
section of Item 7 of this Report for further information
regarding LTIP. Additional information regarding our
transactions related to Visa is included in Note 25
Commitments And Guarantees in the Notes To Consolidated
Financial Statements included in Item 8 of this Report. Further
details regarding our trading activities are included in the
Market Risk Management – Trading Risk portion of the Risk
Management section of this Item 7 and information regarding
equity management are included in the Market Risk
Management-Equity and Other Investment Risk section.
Other noninterest income typically fluctuates from period to
period depending on the nature and magnitude of transactions
completed.
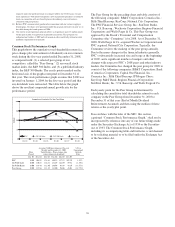
We expect noninterest income in 2009 to reflect customer
growth, offset by softening consumer fees and by ongoing
volatility of the more market-related categories.
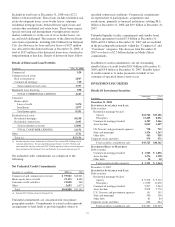
P
RODUCT
R
EVENUE
In addition to credit and deposit products for commercial
customers, Corporate & Institutional Banking offers other
services, including treasury management and capital markets-
related products and services and commercial mortgage loan
servicing, that are marketed by several businesses to
commercial and retail customers across PNC.
Treasury management revenue, which includes fees as well as
net interest income from customer deposit balances, increased
14% to $545 million in 2008 compared with $476 million in
2007. The increase was primarily related to the impact of our
expansion into new markets and strong growth in commercial
payment card services and in cash and liquidity management
products.
Revenue from capital markets-related products and services
totaled $336 million in 2008 compared with $290 million in
2007. This increase was primarily driven by strong customer
interest rate derivative and foreign exchange activity partially
offset by a decline in merger and acquisition advisory fees.
Commercial mortgage banking activities include revenue
derived from loan originations, commercial mortgage
servicing (including net interest income and noninterest
income from loan servicing and ancillary services), gains from
loan sales, valuation adjustments, net interest income on loans
held for sale, and related commitments and hedges.
29