PNC Bank 2008 Annual Report Download - page 117
Download and view the complete annual report
Please find page 117 of the 2008 PNC Bank annual report below. You can navigate through the pages in the report by either clicking on the pages listed below, or by using the keyword search tool below to find specific information within the annual report.-
 1
1 -
2
-
3
-
4
-
5
-
6
-
7
-
8
-
9
-
10
-
11
-
12
-
13
-
14
-
15
-
16
-
17
-
18
-
19
-
20
-
21
-
22
-
23
-
24
-
25
-
26
-
27
-
28
-
29
-
30
-
31
-
32
-
33
-
34
-
35
-
36
-
37
-
38
-
39
-
40
-
41
-
42
-
43
-
44
-
45
-
46
-
47
-
48
-
49
-
50
-
51
-
52
-
53
-
54
-
55
-
56
-
57
-
58
-
59
-
60
-
61
-
62
-
63
-
64
-
65
-
66
-
67
-
68
-
69
-
70
-
71
-
72
-
73
-
74
-
75
-
76
-
77
-
78
-
79
-
80
-
81
-
82
-
83
-
84
-
85
-
86
-
87
-
88
-
89
-
90
-
91
-
92
-
93
-
94
-
95
-
96
-
97
-
98
-
99
-
100
-
101
-
102
-
103
-
104
-
105
-
106
-
 107
107 -
 108
108 -
 109
109 -
 110
110 -
 111
111 -
 112
112 -
 113
113 -
 114
114 -
 115
115 -
 116
116 -
 117
117 -
 118
118 -
 119
119 -
 120
120 -
 121
121 -
 122
122 -
 123
123 -
 124
124 -
 125
125 -
 126
126 -
 127
127 -
128
-
129
-
130
-
131
-
132
-
133
-
134
-
135
-
136
-
137
-
138
-
139
-
140
-
141
-
142
-
143
-
144
-
145
-
146
-
147
-
148
-
149
-
150
-
151
-
152
-
153
-
154
-
155
-
156
-
157
-
158
-
159
-
160
-
161
-
162
-
163
-
164
-
165
-
166
-
167
-
168
-
169
-
170
-
171
-
172
-
173
-
174
-
175
-
176
-
177
-
178
-
179
-
180
-
181
-
182
-
183
-
184
 |
 |

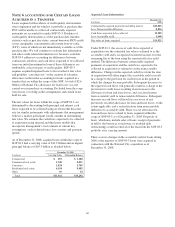
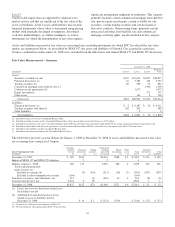
Readily observable market inputs to this model can be
validated to external sources, including yield curves, implied
volatility or other market related data. Changes in fair value
due to instrument-specific credit risk for 2008 were not
material. At December 31, 2008, structured resale agreements
with an aggregate fair value of $1.1 billion were included in
federal funds sold and resale agreements on our Consolidated
Balance Sheet. The aggregate outstanding principal balance
was $980 million. Interest income on structured resale
agreements is reported in the Consolidated Income Statement
in the caption Interest Income – Other.
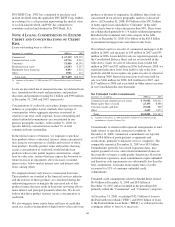
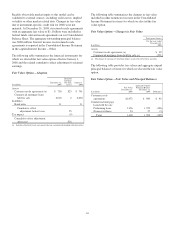
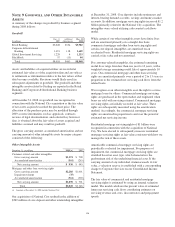
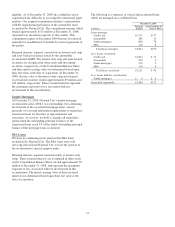
The following table summarizes the financial instruments for
which we elected the fair value option effective January 1,
2008 and the related cumulative-effect adjustment to retained
earnings.
Fair Value Option – Adoption
In millions
December 31,
2007
Retained
Earnings
Net Gain
(Loss)
January 1,
2008
Assets
Customer resale agreements (a) $ 738 $23 $ 761
Commercial mortgage loans
held for sale 2,018 2 2,020
Liabilities
Bank notes 11 11
Cumulative–effect
adjustment, before taxes 25
Tax impact (9)
Cumulative-effect adjustment,
after taxes $16
(a) Includes structured resale agreements that are economically hedged with derivatives.
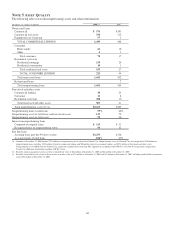
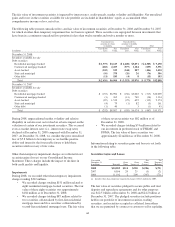
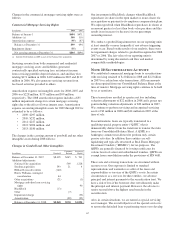
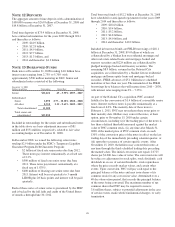
The following table summarizes the changes in fair value
included in other noninterest income in the Consolidated
Income Statement for items for which we elected the fair
value option.
Fair Value Option – Changes in Fair Value
Total gains (losses)
In millions
For the year ended
December 31,
2008
Assets
Customer resale agreements (a) $ 69
Commercial mortgage loans held for sale (a) (251)
(a) The impact on earnings of offsetting hedges is not reflected in these amounts.
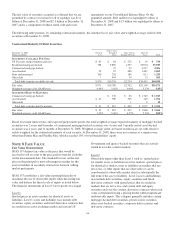
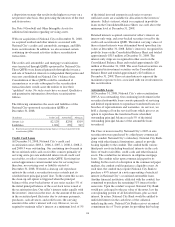
The following table provides fair values and aggregate unpaid
principal balances of items for which we elected the fair value
option.
Fair Value Option – Fair Value and Principal Balances
In millions
Fair Value
December 31,
2008
Aggregate Unpaid
Principal Balance
December 31,
2008 Difference
Customer resale
agreements $1,072 $ 980 $ 92
Commercial mortgage
loans held for sale
Performing loans 1,376 1,572 (196)
Nonaccrual loans 24 27 (3)
Total 1,400 1,599 (199)
113