PNC Bank 2008 Annual Report Download - page 37
Download and view the complete annual report
Please find page 37 of the 2008 PNC Bank annual report below. You can navigate through the pages in the report by either clicking on the pages listed below, or by using the keyword search tool below to find specific information within the annual report.-
 1
1 -
2
-
3
-
4
-
5
-
6
-
7
-
8
-
9
-
10
-
11
-
12
-
13
-
14
-
15
-
16
-
17
-
18
-
19
-
20
-
21
-
22
-
23
-
24
-
25
-
26
-
 27
27 -
 28
28 -
 29
29 -
 30
30 -
 31
31 -
 32
32 -
 33
33 -
 34
34 -
 35
35 -
 36
36 -
 37
37 -
 38
38 -
 39
39 -
 40
40 -
 41
41 -
 42
42 -
 43
43 -
 44
44 -
 45
45 -
 46
46 -
 47
47 -
48
-
49
-
50
-
51
-
52
-
53
-
54
-
55
-
56
-
57
-
58
-
59
-
60
-
61
-
62
-
63
-
64
-
65
-
66
-
67
-
68
-
69
-
70
-
71
-
72
-
73
-
74
-
75
-
76
-
77
-
78
-
79
-
80
-
81
-
82
-
83
-
84
-
85
-
86
-
87
-
88
-
89
-
90
-
91
-
92
-
93
-
94
-
95
-
96
-
97
-
98
-
99
-
100
-
101
-
102
-
103
-
104
-
105
-
106
-
107
-
108
-
109
-
110
-
111
-
112
-
113
-
114
-
115
-
116
-
117
-
118
-
119
-
120
-
121
-
122
-
123
-
124
-
125
-
126
-
127
-
128
-
129
-
130
-
131
-
132
-
133
-
134
-
135
-
136
-
137
-
138
-
139
-
140
-
141
-
142
-
143
-
144
-
145
-
146
-
147
-
148
-
149
-
150
-
151
-
152
-
153
-
154
-
155
-
156
-
157
-
158
-
159
-
160
-
161
-
162
-
163
-
164
-
165
-
166
-
167
-
168
-
169
-
170
-
171
-
172
-
173
-
174
-
175
-
176
-
177
-
178
-
179
-
180
-
181
-
182
-
183
-
184
 |
 |

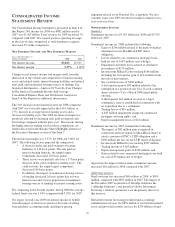
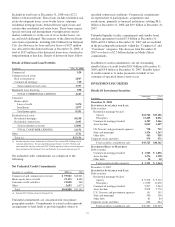
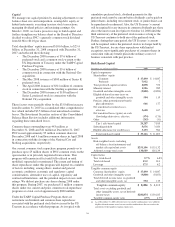
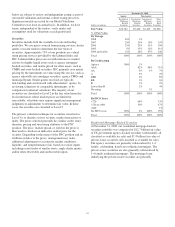
Included in total loans at December 31, 2008 were $27.2
billion of distressed loans. These loans include residential real
estate development loans, cross-border leases, subprime
residential mortgage loans, brokered home equity loans and
certain other residential real estate loans. These loans require
special servicing and management oversight given current
market conditions or, in the case of cross-border leases, are
tax and yield challenged. The majority of the distressed loans
were from acquisitions, including $24.6 billion from National
City. An allowance for loan and lease losses of $927 million
was allocated to the distressed loans at December 31, 2008. A
total of $537 million of the distressed loans were classified as
nonperforming at that date. Details of distressed loans follow:
Details of Distressed Loan Portfolio
In millions Dec. 31, 2008
Commercial $28
Commercial real estate
Real estate projects 2,847
Commercial mortgage 510
Total commercial real estate 3,357
Equipment lease financing 858
TOTAL COMMERCIAL LENDING 4,243
Consumer
Home equity
Lines of credit 5,474
Installment 2,877
Total home equity 8,351
Residential real estate
Residential mortgage 10,198
Residential construction 2,603
Total residential real estate 12,801
TOTAL CONSUMER LENDING 21,152
Other 1,761
Total (a) $27,156
(a) Includes impaired loans attributable to National City totaling $10.3 billion, net of
valuation adjustments. The pre-adjusted principal balance was $15.3 billion and
represented the majority of the total $19.3 billion principal balance of total impaired
loans included in the National City Loan Portfolio Assessment table on page 32.
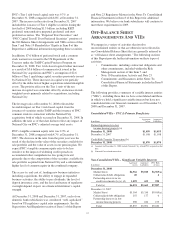
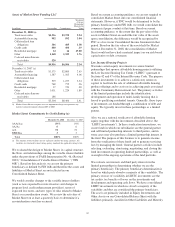
Net unfunded credit commitments are comprised of the
following:
Net Unfunded Credit Commitments
December 31 - in millions 2008 (a) 2007
Commercial and commercial real estate $ 59,982 $42,021
Home equity lines of credit 23,195 8,680
Consumer credit card lines 19,028 969
Other 2,683 1,677
Total $104,888 $53,347
(a) Includes $53.9 billion related to National City.
Unfunded commitments are concentrated in our primary
geographic markets. Commitments to extend credit represent
arrangements to lend funds or provide liquidity subject to
specified contractual conditions. Commercial commitments
are reported net of participations, assignments and
syndications, primarily to financial institutions, totaling $8.6
billion at December 31, 2008 and $8.9 billion at December 31,
2007.
Unfunded liquidity facility commitments and standby bond
purchase agreements totaled $7.0 billion at December 31,
2008 and $9.4 billion at December 31, 2007 and are included
in the preceding table primarily within the “Commercial” and
“Consumer” categories. The decrease from December 31,
2007 was due to a $2.5 billion decline in Market Street
commitments.
In addition to credit commitments, our net outstanding
standby letters of credit totaled $10.3 billion at December 31,
2008 and $4.8 billion at December 31, 2007. Standby letters
of credit commit us to make payments on behalf of our
customers if specified future events occur.
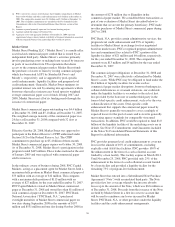
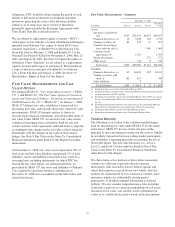
INVESTMENT SECURITIES
Details Of Investment Securities
In millions
Amortized
Cost
Fair
Value
December 31, 2008
S
ECURITIES
A
VAILABLE FOR
S
ALE
Debt securities
Residential mortgage-backed
Agency $22,744 $23,106
Nonagency 13,205 8,831
Commercial mortgage-backed 4,305 3,446
Asset-backed 2,069 1,627
US Treasury and government agencies 738 739
State and municipal 1,326 1,263
Other debt 563 559
Corporate stocks and other 575 571
Total securities available for sale $45,525 $40,142
S
ECURITIES
H
ELD TO
M
ATURITY
Debt securities
Commercial mortgage-backed $ 1,945 $ 1,896
Asset-backed 1,376 1,358
Other debt 10 10
Total securities held to maturity $ 3,331 $ 3,264
December 31, 2007
S
ECURITIES
A
VAILABLE FOR
S
ALE
Debt securities
Residential mortgage-backed
Agency $ 9,218 $ 9,314
Nonagency 11,929 11,638
Commercial mortgage-backed 5,227 5,264
Asset-backed 2,878 2,770
U.S. Treasury and government agencies 151 155
State and municipal 340 336
Other debt 85 84
Corporate stocks and other 662 664
Total securities available for sale $30,490 $30,225
33