PNC Bank 2008 Annual Report Download - page 66
Download and view the complete annual report
Please find page 66 of the 2008 PNC Bank annual report below. You can navigate through the pages in the report by either clicking on the pages listed below, or by using the keyword search tool below to find specific information within the annual report.-
 1
1 -
2
-
3
-
4
-
5
-
6
-
7
-
8
-
9
-
10
-
11
-
12
-
13
-
14
-
15
-
16
-
17
-
18
-
19
-
20
-
21
-
22
-
23
-
24
-
25
-
26
-
27
-
28
-
29
-
30
-
31
-
32
-
33
-
34
-
35
-
36
-
37
-
38
-
39
-
40
-
41
-
42
-
43
-
44
-
45
-
46
-
47
-
48
-
49
-
50
-
51
-
52
-
53
-
54
-
55
-
 56
56 -
 57
57 -
 58
58 -
 59
59 -
 60
60 -
 61
61 -
 62
62 -
 63
63 -
 64
64 -
 65
65 -
 66
66 -
 67
67 -
 68
68 -
 69
69 -
 70
70 -
 71
71 -
 72
72 -
 73
73 -
 74
74 -
 75
75 -
 76
76 -
77
-
78
-
79
-
80
-
81
-
82
-
83
-
84
-
85
-
86
-
87
-
88
-
89
-
90
-
91
-
92
-
93
-
94
-
95
-
96
-
97
-
98
-
99
-
100
-
101
-
102
-
103
-
104
-
105
-
106
-
107
-
108
-
109
-
110
-
111
-
112
-
113
-
114
-
115
-
116
-
117
-
118
-
119
-
120
-
121
-
122
-
123
-
124
-
125
-
126
-
127
-
128
-
129
-
130
-
131
-
132
-
133
-
134
-
135
-
136
-
137
-
138
-
139
-
140
-
141
-
142
-
143
-
144
-
145
-
146
-
147
-
148
-
149
-
150
-
151
-
152
-
153
-
154
-
155
-
156
-
157
-
158
-
159
-
160
-
161
-
162
-
163
-
164
-
165
-
166
-
167
-
168
-
169
-
170
-
171
-
172
-
173
-
174
-
175
-
176
-
177
-
178
-
179
-
180
-
181
-
182
-
183
-
184
 |
 |

aggregate of the allowance for loan and lease losses and
allowance for unfunded loan commitments and letters of
credit would increase by $128 million. Additionally, other
factors such as the rate of migration in the severity of problem
loans will contribute to the final pool reserve allocations.
We make consumer (including residential mortgage) loan
allocations at a total portfolio level by consumer product line
based on historical loss experience. We compute a four-
quarter average loss rate from net charge-offs for the prior
four quarters as a percentage of the average loans outstanding
in those quarters. We apply this loss rate to loans outstanding
at the end of the current period and make certain qualitative
adjustments to determine the consumer loan allocation.
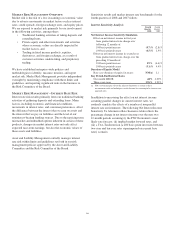
The provision for credit losses totaled $1.517 billion for 2008
compared with $315 million for 2007. Of the total 2008
provision, $990 million was recorded in the fourth quarter,
including $504 million of additional provision recorded at
December 31, 2008 to conform the National City loan
reserving methodology with ours. The differences in
methodology include granularity of loss computations,
statistical and quantitative factors rather than qualitative
assessment, and the extent of current appraisals and risk
assessments.
In addition to the impact of National City, the higher provision
in 2008 compared with the prior year was driven by general
credit quality migration, including residential real estate
development and commercial real estate exposure, an increase
in net charge-offs, and growth in nonperforming loans.
Growth in our total credit exposure also contributed to the
higher provision amounts in both comparisons.
In addition, the provision for credit losses for 2008 and the
evaluation of the allowances for loan and lease losses and
unfunded loan commitments and letters of credit as of
December 31, 2008 reflected loan and total credit exposure
growth, changes in loan portfolio composition, and other
changes in asset quality. The provision includes amounts for
probable losses on loans and credit exposure related to
unfunded loan commitments and letters of credit.
With a deteriorating economy, we expect credit migration will
continue throughout 2009 as credit quality improvements will
lag any economic turnaround.
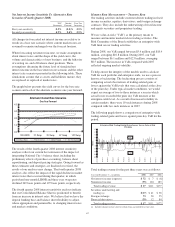
The allowance as a percent of nonperforming loans was 236%
and as a percent of total loans was 2.23% at December 31,
2008. These percentages excluding the impact of the National
City acquisition were 95% and 1.77%, respectively. We
provide a reconciliation of these percentages excluding the
National City impact to the GAAP-basis percentages in the
Statistical Information (Unaudited) section in Item 8 of this
Report. The comparable percentages at December 31, 2007
were 183% and 1.21%. We expect to continue to increase our
allowance as a percent of total loans as the market and our
credit quality migration dictates.
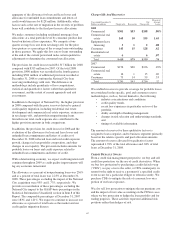
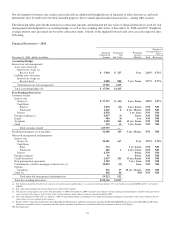
Charge-Offs And Recoveries
Year ended December 31
Dollars in millions Charge-offs Recoveries
Net
Charge-offs
Percent of
Average
Loans
2008
Commercial $301 $53 $248 .80%
Commercial real
estate 165 10 155 1.65
Equipment lease
financing 3 1 2 .08
Consumer 143 15 128 .62
Residential real
estate 6 6 .07
Total $ 618 $ 79 $ 539 .74
2007
Commercial $156 $30 $126 .49%
Commercial real
estate 16 1 15 .20
Consumer 73 14 59 .33
Total $ 245 $ 45 $ 200 .32
We establish reserves to provide coverage for probable losses
not considered in the specific, pool and consumer reserve
methodologies, such as, but not limited to, the following:
• industry concentrations and conditions,
• credit quality trends,
• recent loss experience in particular sectors of the
portfolio,
• ability and depth of lending management,
• changes in risk selection and underwriting standards,
and
• timing of available information.
The amount of reserves for these qualitative factors is
assigned to loan categories and to business segments primarily
based on the relative specific and pool allocation amounts.
The amount of reserve allocated for qualitative factors
represented 1.76% of the total allowance and .04% of total
loans at December 31, 2008.
C
REDIT
D
EFAULT
S
WAPS
From a credit risk management perspective, we buy and sell
credit loss protection via the use of credit derivatives. When
we buy loss protection by purchasing a credit default swap
(“CDS”), we pay a fee to the seller, or CDS counterparty, in
return for the right to receive a payment if a specified credit
event occurs for a particular obligor or reference entity. We
purchase CDSs to mitigate the risk of economic loss on a
portion of our loan exposures.
We also sell loss protection to mitigate the net premium cost
and the impact of fair value accounting on the CDS in cases
where we buy protection to hedge the loan portfolio and for
trading purposes. These activities represent additional risk
positions rather than hedges of risk.
62