PNC Bank 2008 Annual Report Download - page 76
Download and view the complete annual report
Please find page 76 of the 2008 PNC Bank annual report below. You can navigate through the pages in the report by either clicking on the pages listed below, or by using the keyword search tool below to find specific information within the annual report.-
 1
1 -
2
-
3
-
4
-
5
-
6
-
7
-
8
-
9
-
10
-
11
-
12
-
13
-
14
-
15
-
16
-
17
-
18
-
19
-
20
-
21
-
22
-
23
-
24
-
25
-
26
-
27
-
28
-
29
-
30
-
31
-
32
-
33
-
34
-
35
-
36
-
37
-
38
-
39
-
40
-
41
-
42
-
43
-
44
-
45
-
46
-
47
-
48
-
49
-
50
-
51
-
52
-
53
-
54
-
55
-
56
-
57
-
58
-
59
-
60
-
61
-
62
-
63
-
64
-
65
-
 66
66 -
 67
67 -
 68
68 -
 69
69 -
 70
70 -
 71
71 -
 72
72 -
 73
73 -
 74
74 -
 75
75 -
 76
76 -
 77
77 -
 78
78 -
 79
79 -
 80
80 -
 81
81 -
 82
82 -
 83
83 -
 84
84 -
 85
85 -
 86
86 -
87
-
88
-
89
-
90
-
91
-
92
-
93
-
94
-
95
-
96
-
97
-
98
-
99
-
100
-
101
-
102
-
103
-
104
-
105
-
106
-
107
-
108
-
109
-
110
-
111
-
112
-
113
-
114
-
115
-
116
-
117
-
118
-
119
-
120
-
121
-
122
-
123
-
124
-
125
-
126
-
127
-
128
-
129
-
130
-
131
-
132
-
133
-
134
-
135
-
136
-
137
-
138
-
139
-
140
-
141
-
142
-
143
-
144
-
145
-
146
-
147
-
148
-
149
-
150
-
151
-
152
-
153
-
154
-
155
-
156
-
157
-
158
-
159
-
160
-
161
-
162
-
163
-
164
-
165
-
166
-
167
-
168
-
169
-
170
-
171
-
172
-
173
-
174
-
175
-
176
-
177
-
178
-
179
-
180
-
181
-
182
-
183
-
184
 |
 |

2007 V
ERSUS
2006
C
ONSOLIDATED
I
NCOME
S
TATEMENT
R
EVIEW
Summary Results
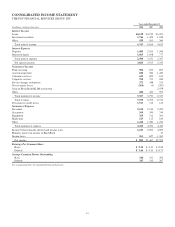
Consolidated net income for 2007 was $1.467 billion or $4.35
per diluted share and for 2006 was $2.595 billion or $8.73 per
diluted share.
Net income for 2006 included the after-tax impact of the
following items:
• The third quarter gain on the BlackRock/MLIM
transaction of $1.3 billion, or $4.36 per diluted share;
• The third quarter securities portfolio rebalancing loss
of $127 million, or $.43 per diluted share;
• BlackRock/MLIM transaction integration costs of
$47 million, or $.16 per diluted share, and
• The third quarter mortgage loan portfolio
repositioning loss of $31 million, or $.10 per diluted
share.
The aggregate impact of these items increased 2006 net
income by $1.1 billion, or $3.67 per diluted share.
Net Interest Income
Net interest income was $2.915 billion for 2007 and $2.245
billion for 2006, an increase of $670 million, or 30%. This
increase was consistent with the $20.3 billion, or 26%,
increase in average interest-earning assets during 2007
compared with 2006. The net interest margin was 3.00% in
2007 and 2.92% for 2006, an increase of 8 basis points.
Provision For Credit Losses
The provision for credit losses totaled $315 million for 2007
and $124 million for 2006. Of the total 2007 provision, $188
million was recorded in the fourth quarter, including
approximately $45 million related to our Yardville
acquisition. The higher provision in 2007 was also impacted
by an increase in our real estate portfolio, including residential
real estate development exposure, and growth in total credit
exposure. Total residential real estate development
outstandings were approximately $2.1 billion at December 31,
2007.
Noninterest Income
Summary
Noninterest income was $3.790 billion for 2007 and $6.327
billion for 2006. Noninterest income for 2007 included the
impact of an $83 million gain recognized in connection with
our transfer of BlackRock shares to satisfy a portion of PNC’s
LTIP obligation and a $210 million net loss representing the
mark-to-market adjustment on our LTIP obligation.
Noninterest income for 2006 included the impact of the
following items:
• The gain on the BlackRock/MLIM transaction, which
totaled $2.078 billion,
• The effects of our third quarter 2006 balance sheet
repositioning activities that resulted in charges
totaling $244 million, and
• PNC consolidated BlackRock in its results for the
first nine months of 2006 but accounted for
BlackRock on the equity method for the fourth
quarter of 2006 and all of 2007. Had our BlackRock
investment been on the equity method for all of 2006,
BlackRock’s noninterest income reported by us
would have been lower by $943 million for that year.
Apart from the impact of these items, noninterest income
increased $367 million, or 10%, in 2007 compared with 2006
largely as a result of the Mercantile acquisition and growth in
several fee income categories.
Additional analysis
Fund servicing fees declined $58 million in 2007, to $835
million, compared with $893 million in the prior year.
Amounts for 2006 included $117 million of distribution fee
revenue at Global Investment Servicing. Effective January 1,
2007, we refined our accounting and reporting of Global
Investment Servicing’s distribution fee revenue and related
expense amounts and present these amounts net on a
prospective basis. Prior to 2007, the distribution amounts were
shown on a gross basis within fund servicing fees and within
other noninterest expense and offset each other entirely with
no impact on earnings.
Apart from the impact of the distribution fee revenue included
in the 2006 amounts, fund servicing fees increased $59
million in 2007 compared with the prior year. Higher revenue
from offshore operations, transfer agency, managed accounts
and alternative investments contributed to the increase in
2007, reflecting net new business and growth from existing
clients.
Asset management fees totaled $784 million for 2007 and
$1.420 billion for 2006. Our equity income from BlackRock
has been included in asset management fees beginning with
the fourth quarter of 2006. Asset management fees were
higher in 2006 as the first nine months of 2006 reflected the
impact of BlackRock’s revenue on a consolidated basis.
Assets managed at December 31, 2007 totaled $74 billion
compared with $54 billion at December 31, 2006. This
increase resulted primarily from the Mercantile acquisition.
Consumer services fees increased $81 million, or 13%, to
$692 million in 2007 compared with 2006. The increase
reflected the impact of Mercantile, higher brokerage fees,
higher debit card revenues resulting from higher transaction
volumes, and fees from the credit card business that began in
the latter part of 2006.
Corporate services revenue was $713 million for 2007, an
increase of $87 million, or 14%, over 2006. Higher revenue
72