PNC Bank 2008 Annual Report Download - page 157
Download and view the complete annual report
Please find page 157 of the 2008 PNC Bank annual report below. You can navigate through the pages in the report by either clicking on the pages listed below, or by using the keyword search tool below to find specific information within the annual report.
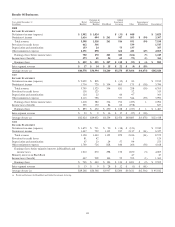
Results Of Businesses
Year ended December 31
In millions
Retail
Banking
Corporate &
Institutional
Banking BlackRock
Global
Investment
Servicing Other
Intercompany
Eliminations Consolidated
2008
I
NCOME
S
TATEMENT
Net interest income (expense) $ 1,982 $ 1,024 $ (31) $ 848 $ 3,823
Noninterest income 1,616 494 $ 261 947 103 $ (54) 3,367
Total revenue 3,598 1,518 261 916 951 (54) 7,190
Provision for credit losses 612 366 539 1,517
Depreciation and amortization 133 24 73 137 367
Other noninterest expense 2,151 858 662 441 (49) 4,063
Earnings (loss) before income taxes 702 270 261 181 (166) (5) 1,243
Income taxes (benefit) 273 45 54 63 (73) (1) 361
Earnings (loss) $ 429 $ 225 $ 207 $ 118 $ (93) $ (4) $ 882
Inter-segment revenue $ 17 $ 14 $ 15 $ 22 $ (9) $ (59)
Average Assets (a) $46,578 $36,994 $4,240 $5,278 $53,604 $(4,674) $142,020
2007
I
NCOME
S
TATEMENT
Net interest income (expense) $ 2,059 $ 805 $ (32) $ 83 $ 2,915
Noninterest income 1,736 720 $ 334 863 175 $ (38) 3,790
Total revenue 3,795 1,525 334 831 258 (38) 6,705
Provision for credit losses 138 125 52 315
Depreciation and amortization 124 22 60 97 303
Other noninterest expense 2,115 796 577 544 (39) 3,993
Earnings (loss) before income taxes 1,418 582 334 194 (435) 1 2,094
Income taxes (benefit) 525 150 84 66 (198) 627
Earnings (loss) $ 893 $ 432 $ 250 $ 128 $ (237) $ 1 $ 1,467
Inter-segment revenue $ 23 $ 9 $ 16 $ 17 $ (27) $ (38)
Average Assets (a) $42,424 $29,052 $4,259 $2,476 $48,885 $(3,678) $123,418
2006
I
NCOME
S
TATEMENT
Net interest income (expense) $ 1,673 $ 711 $ 20 $ (38) $ (121) $ 2,245
Noninterest income 1,447 752 1,135 917 2,137 $ (61) 6,327
Total revenue 3,120 1,463 1,155 879 2,016 (61) 8,572
Provision for credit losses 81 42 1 124
Depreciation and amortization 67 23 29 57 99 275
Other noninterest expense 1,760 726 828 646 266 (58) 4,168
Earnings (loss) before minority interests in BlackRock and
income taxes 1,212 672 298 176 1,650 (3) 4,005
Minority interests in BlackRock 47 47
Income taxes (benefit) 447 209 104 52 552 (1) 1,363
Earnings (loss) $ 765 $ 463 $ 194 $ 124 $ 1,051 $ (2) $ 2,595
Inter-segment revenue $ 13 $ 9 $ 28 $ 12 $ (1) $ (61)
Average Assets (a) $29,248 $26,548 $3,937 $2,204 $35,611 $(2,536) $ 95,012
(a) Period-end balances for BlackRock and Global Investment Servicing.
153


