PNC Bank 2008 Annual Report Download - page 161
Download and view the complete annual report
Please find page 161 of the 2008 PNC Bank annual report below. You can navigate through the pages in the report by either clicking on the pages listed below, or by using the keyword search tool below to find specific information within the annual report.-
 1
1 -
2
-
3
-
4
-
5
-
6
-
7
-
8
-
9
-
10
-
11
-
12
-
13
-
14
-
15
-
16
-
17
-
18
-
19
-
20
-
21
-
22
-
23
-
24
-
25
-
26
-
27
-
28
-
29
-
30
-
31
-
32
-
33
-
34
-
35
-
36
-
37
-
38
-
39
-
40
-
41
-
42
-
43
-
44
-
45
-
46
-
47
-
48
-
49
-
50
-
51
-
52
-
53
-
54
-
55
-
56
-
57
-
58
-
59
-
60
-
61
-
62
-
63
-
64
-
65
-
66
-
67
-
68
-
69
-
70
-
71
-
72
-
73
-
74
-
75
-
76
-
77
-
78
-
79
-
80
-
81
-
82
-
83
-
84
-
85
-
86
-
87
-
88
-
89
-
90
-
91
-
92
-
93
-
94
-
95
-
96
-
97
-
98
-
99
-
100
-
101
-
102
-
103
-
104
-
105
-
106
-
107
-
108
-
109
-
110
-
111
-
112
-
113
-
114
-
115
-
116
-
117
-
118
-
119
-
120
-
121
-
122
-
123
-
124
-
125
-
126
-
127
-
128
-
129
-
130
-
131
-
132
-
133
-
134
-
135
-
136
-
137
-
138
-
139
-
140
-
141
-
142
-
143
-
144
-
145
-
146
-
147
-
148
-
149
-
150
-
 151
151 -
 152
152 -
 153
153 -
 154
154 -
 155
155 -
 156
156 -
 157
157 -
 158
158 -
 159
159 -
 160
160 -
 161
161 -
 162
162 -
 163
163 -
 164
164 -
 165
165 -
 166
166 -
 167
167 -
 168
168 -
 169
169 -
 170
170 -
 171
171 -
172
-
173
-
174
-
175
-
176
-
177
-
178
-
179
-
180
-
181
-
182
-
183
-
184
 |
 |

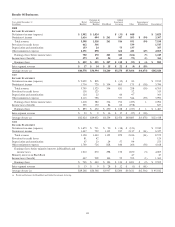
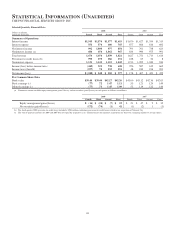
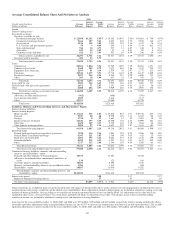
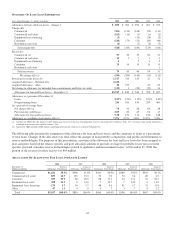
Average Consolidated Balance Sheet And Net Interest Analysis
2008 2007 2006
Taxable-equivalent basis
Dollars in millions
Average
Balances
Interest
Income/
Expense
Average
Yields/
Rates
Average
Balances
Interest
Income/
Expense
Average
Yields/
Rates
Average
Balances
Interest
Income/
Expense
Average
Yields/
Rates
Assets
Interest-earning assets
Investment securities
Securities available for sale
Residential mortgage-backed $ 22,058 $1,202 5.45% $ 19,163 $1,041 5.43% $14,881 $ 740 4.97%
Commercial mortgage-backed 5,666 307 5.42 4,025 222 5.52 2,305 110 4.77
Asset-backed 3,126 159 5.09 2,394 122 5.10 1,312 70 5.34
U.S. Treasury and government agencies 50 3 6.00 293 13 4.44 2,334 102 4.37
State and municipal 764 36 4.71 227 11 4.85 148 8 5.41
Other debt 220 12 5.45 47 4 8.51 89 6 6.74
Corporate stocks and other 412 12 2.91 392 18 4.59 246 14 5.69
Total securities available for sale 32,296 1,731 5.36 26,541 1,431 5.39 21,315 1,050 4.93
Securities held to maturity 402 23 5.72
Total investment securities 32,698 1,754 5.36 26,541 1,431 5.39 21,315 1,050 4.93
Loans
Commercial 30,962 1,844 5.96 25,509 1,859 7.29 20,201 1,451 7.18
Commercial real estate 9,368 542 5.79 7,671 603 7.86 3,212 232 7.22
Equipment lease financing 2,566 81 3.16 2,559 76 2.97 2,777 123 4.43
Consumer 20,526 1,135 5.53 17,718 1,167 6.59 16,125 1,009 6.26
Residential mortgage 9,017 536 5.94 8,564 512 5.98 6,888 375 5.44
Other 305 18 5.90 432 31 7.18 363 26 7.16
Total loans 72,744 4,156 5.71 62,453 4,248 6.80 49,566 3,216 6.49
Loans held for sale 2,502 166 6.63 2,955 184 6.23 2,683 157 5.85
Federal funds sold and resale agreements 2,472 71 2.87 2,152 104 4.83 1,143 58 5.07
Other 4,068 202 4.97 3,909 226 5.78 2,985 156 5.23
Total interest-earning assets/interest income 114,484 6,349 5.55 98,010 6,193 6.32 77,692 4,637 5.97
Noninterest-earning assets
Allowance for loan and lease losses (962) (690) (591)
Cash and due from banks 2,705 3,018 3,121
Other 25,793 23,080 14,790
Total assets $142,020 $123,418 $95,012
Liabilities, Minority and Noncontrolling Interests, and Shareholders’ Equity
Interest-bearing liabilities
Interest-bearing deposits
Money market $ 27,625 566 2.05 $ 23,840 827 3.47 $19,745 663 3.36
Demand 9,947 68 .68 9,259 103 1.11 8,187 88 1.07
Savings 2,714 8 .29 2,687 12 .45 2,081 10 .48
Retail certificates of deposit 16,642 597 3.59 16,690 776 4.65 13,999 582 4.16
Other time 4,424 149 3.37 2,119 110 5.19 1,364 66 4.84
Time deposits in foreign offices 5,006 97 1.94 4,623 225 4.87 3,613 181 5.01
Total interest-bearing deposits 66,358 1,485 2.24 59,218 2,053 3.47 48,989 1,590 3.25
Borrowed funds
Federal funds purchased and repurchase agreements 7,228 156 2.16 7,983 394 4.94 5,286 258 4.88
Federal Home Loan Bank borrowings 9,303 321 3.45 2,168 109 5.03 623 25 4.01
Bank notes and senior debt 6,064 197 3.25 6,282 337 5.36 3,128 159 5.08
Subordinated debt 4,990 219 4.39 4,247 251 5.91 4,417 269 6.09
Other 3,737 112 3.00 2,344 107 4.56 1,589 66 4.15
Total borrowed funds 31,322 1,005 3.21 23,024 1,198 5.20 15,043 777 5.17
Total interest-bearing liabilities/interest expense 97,680 2,490 2.55 82,242 3,251 3.95 64,032 2,367 3.70
Noninterest-bearing liabilities, minority and noncontrolling
interests, and shareholders’ equity
Demand and other noninterest-bearing deposits 18,155 17,587 14,320
Allowance for unfunded loan commitments and letters of
credit 134 125 106
Accrued expenses and other liabilities 10,033 8,195 6,672
Minority and noncontrolling interests in consolidated entities 1,981 1,335 600
Shareholders’ equity 14,037 13,934 9,282
Total liabilities, minority and noncontrolling interests, and
shareholders’ equity $142,020 $123,418 $95,012
Interest rate spread 3.00 2.37 2.27
Impact of noninterest-bearing sources .37 .63 .65
Net interest income/margin $3,859 3.37% $ 2,942 3.00% $2,270 2.92%
Nonaccrual loans are included in loans, net of unearned income. The impact of financial derivatives used in interest rate risk management is included in the interest
income/expense and average yields/rates of the related assets and liabilities. Basis adjustments related to hedged items are included in noninterest-earning assets and
noninterest-bearing liabilities. Average balances of securities are based on amortized historical cost (excluding SFAS 115 adjustments to fair value which are
included in other assets). Average balances for certain loans and borrowed funds accounted for at fair value, with changes in fair value recorded in trading
noninterest income, are included in noninterest-earning assets and noninterest-bearing liabilities.
Loan fees for the years ended December 31, 2008, 2007 and 2006 were $55 million, $39 million and $35 million, respectively. Interest income includes the effects
of taxable-equivalent adjustments using a marginal federal income tax rate of 35% to increase tax-exempt interest income to a taxable-equivalent basis. The taxable-
equivalent adjustments to interest income for the years ended December 31, 2008, 2007 and 2006 were $36 million, $27 million and $25 million, respectively.
157